2022 .nz consumers and businesses research
Consumers and businesses of Aotearoa trust .nz more than other domain names, according to 2022 research.
When COVID-19 hit, online access became a lifeline for many New Zealanders, enabling people to learn, work, trade, and shop online.
.nz domain name registrations have reached an all-time high during the pandemic, so in early 2022, InternetNZ surveyed consumers and businesses in Aotearoa again. We asked about their online presence, domain names use and COVID-19 effects on their businesses.
There is still a gap between how consumers and businesses see things, and that difference presents an interesting opportunity for companies wanting to close the gap. However, both businesses and consumers believe in the importance of websites for successful communication and agree that .nz is more trustworthy than other domain names.
Download .nz consumers and businesses research results as a PDF infographic or scroll down for a web version with charts' descriptions.
Online presence and digital touchpoints
80% of businesses see websites as the most important online presence, but only 53% of businesses have a website.
Figure 1: businesses online presence
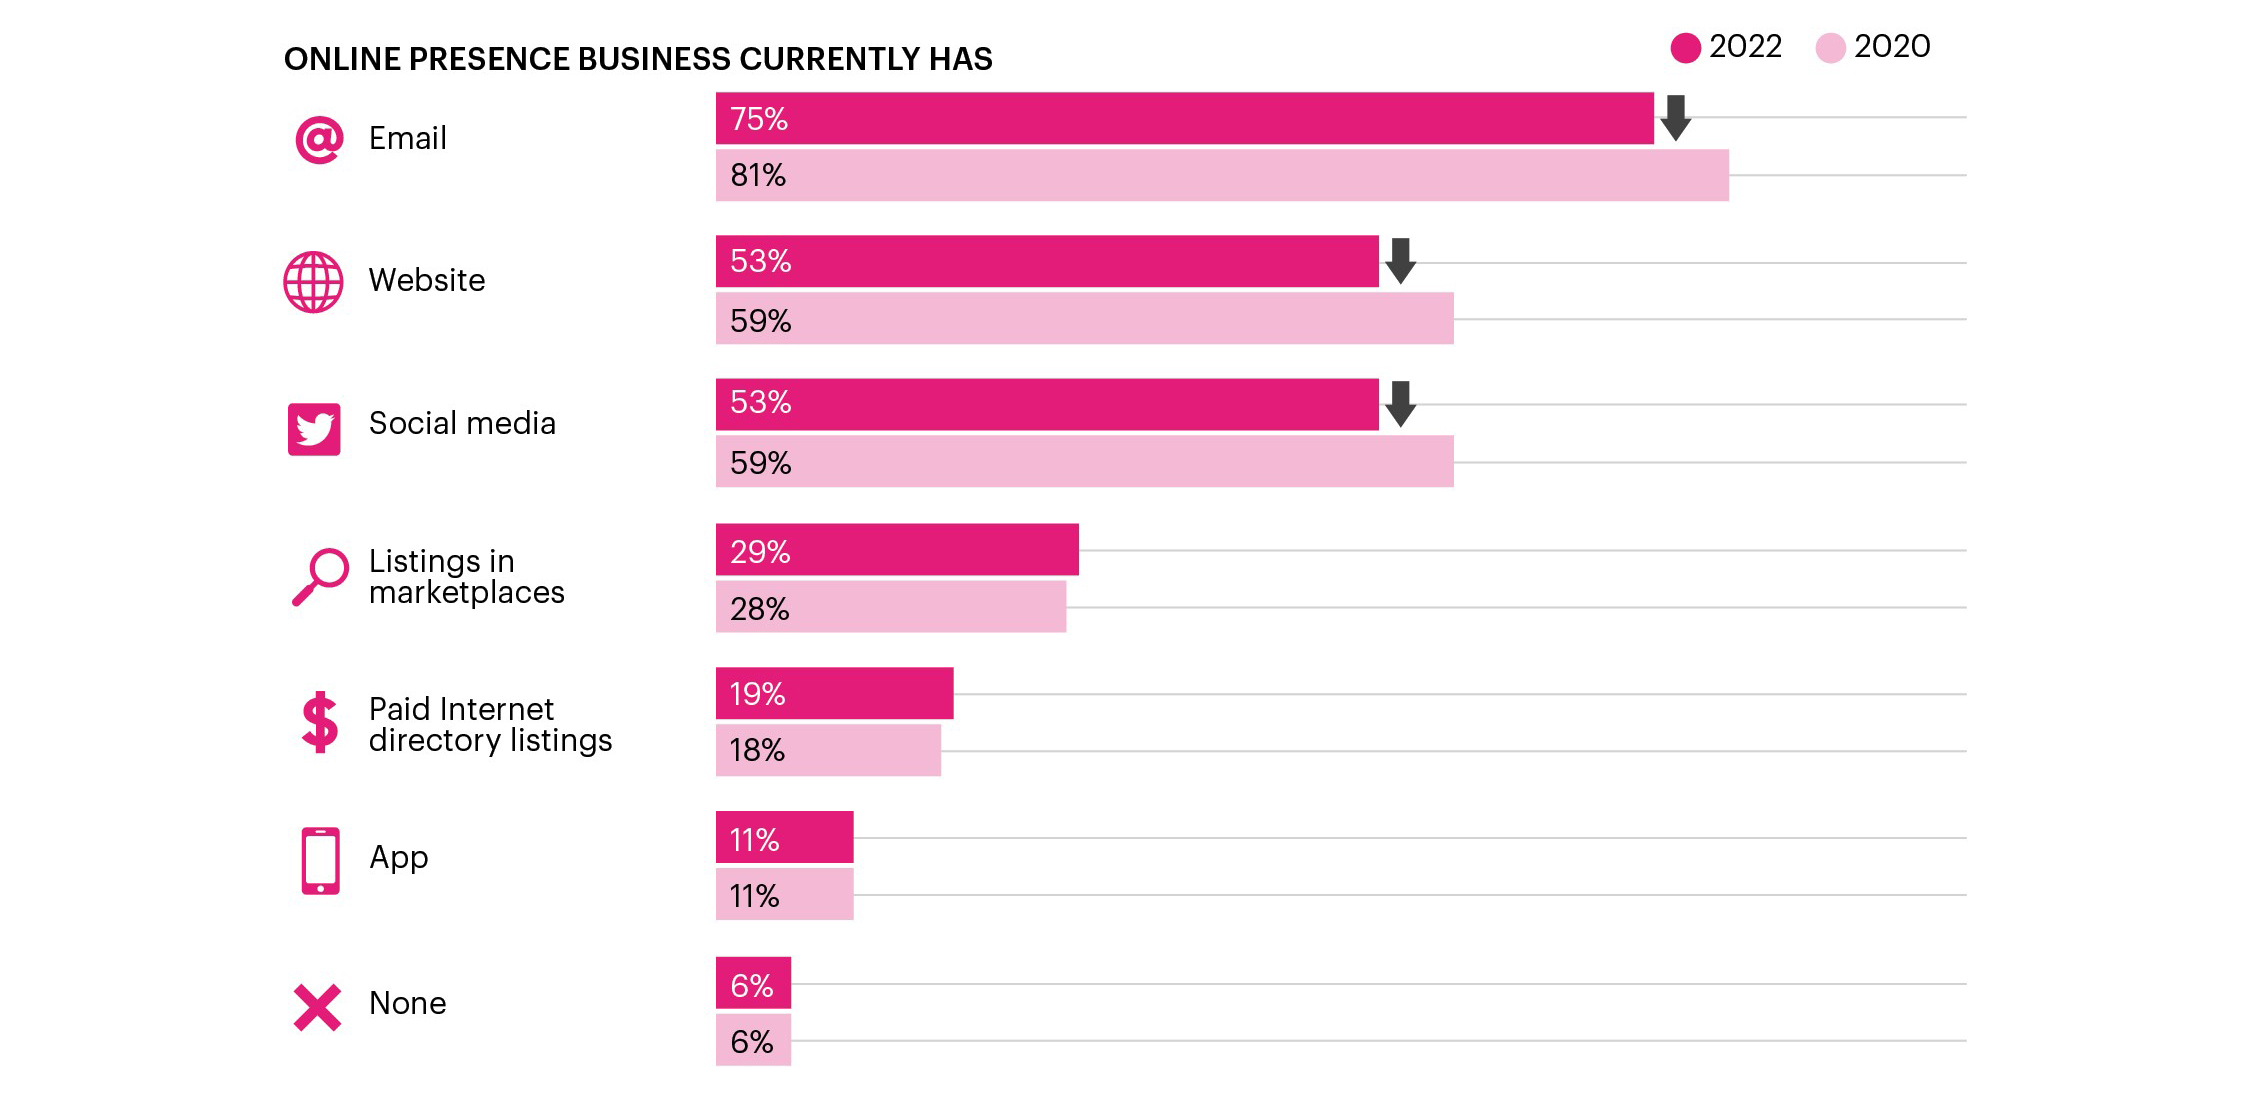
Businesses online presence chart description
The chart shows a comparison of types of online presence businesses in New Zealand have in 2020 and 2022. It shows that email, websites and social media are the most popular types of online presence both in 2020 and 2022. The number of businesses that have email, website or social media online presence in 2022 has slightly decreased compared to 2020.
The chart also shows less popular types of online presence for businesses: listings in marketplaces and paid Internet directories, applications and none.
Numerical values presented on the image
| Type of online presence | 2020 | 2022 |
| 81% | 75% | |
| Website | 59% | 53% |
| Social media | 59% | 53% |
| Listings in marketplaces | 28% | 29% |
| Paid Internet directory listings | 18% | 19% |
| App | 11% | 11% |
| None | 6% | 6% |
Figure 2: online presence ranking
Online presence ranking chart description
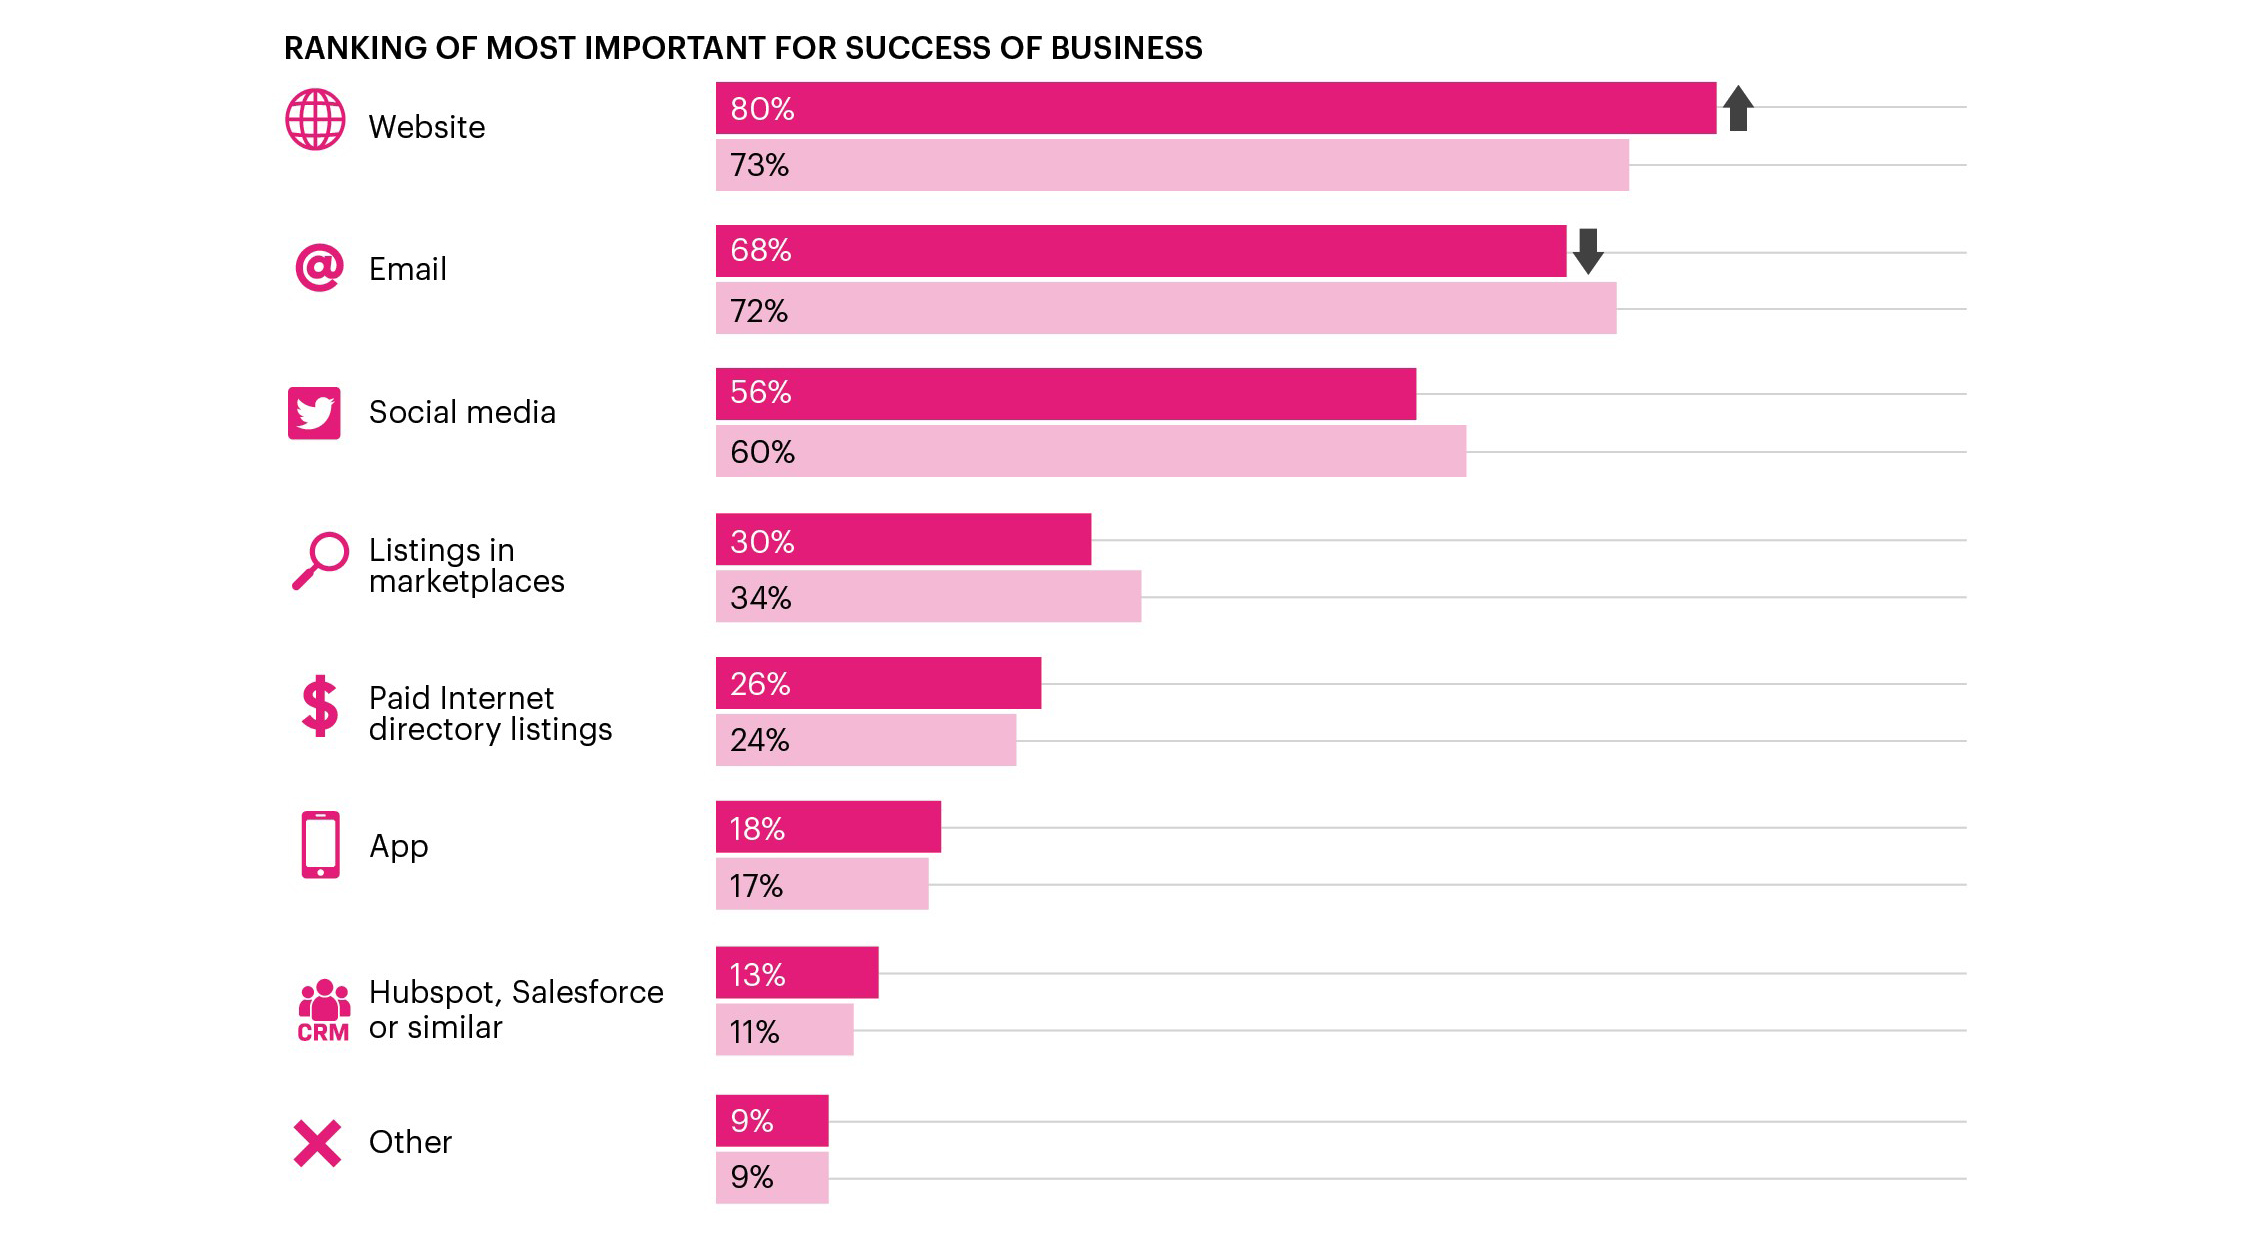
The chart shows the ranking of the most important for success of business types of online presence. The chart shows the rankings comparison in 2020 and 2022. It shows that websites, email and social media have the highest rank compared to other types of online presence. The websites' rank in 2022 is higher than in 2020, and email's rank in 2022 has decreased compared to 2020.
Numerical values presented on the image:
| Type of online presence | 2020 | 2022 |
| Website | 73% | 80% |
| 72% | 68% | |
| Social media | 60% | 56% |
| Listings in marketplaces | 34% | 30% |
| Paid Internet directory listings | 24% | 26% |
| App | 17% | 18% |
|
Hubspot, Salesforce or similar |
11% | 13% |
|
Other |
9% | 9% |
Figure 2 description ends.
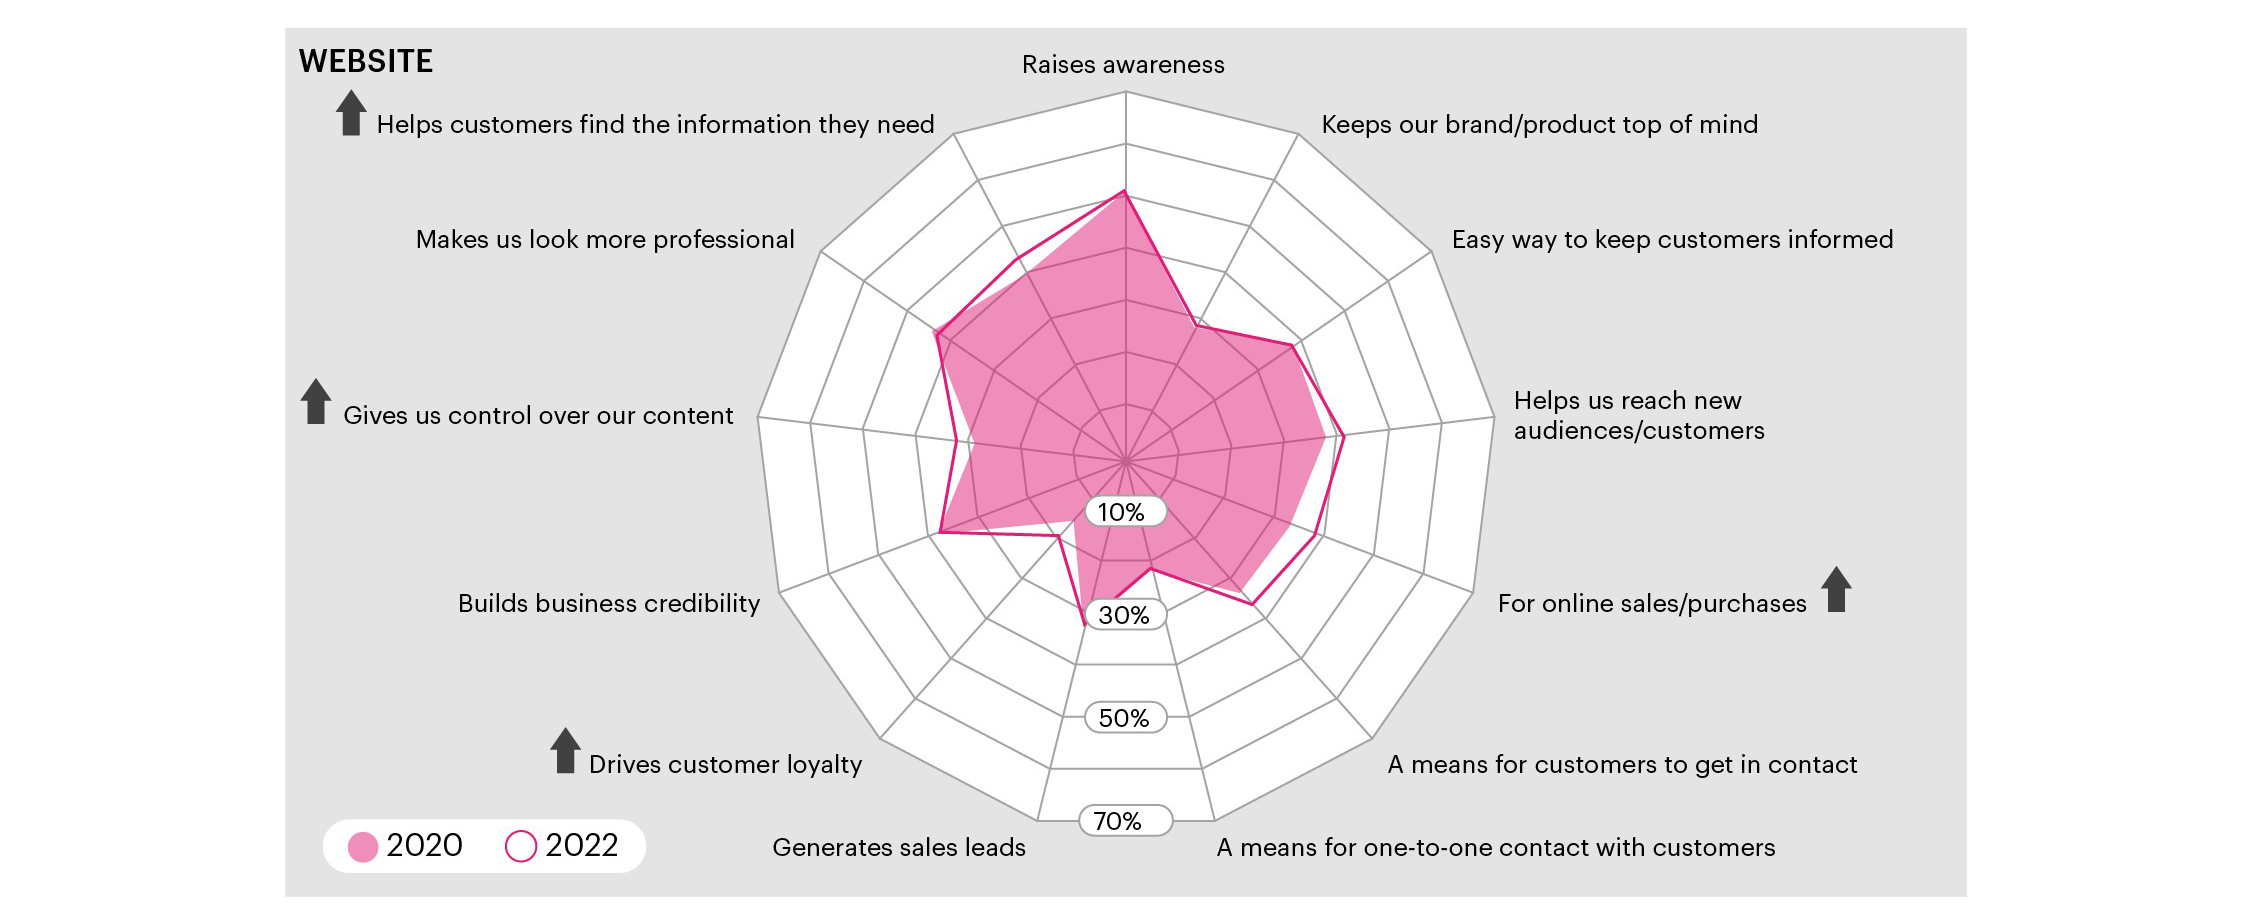
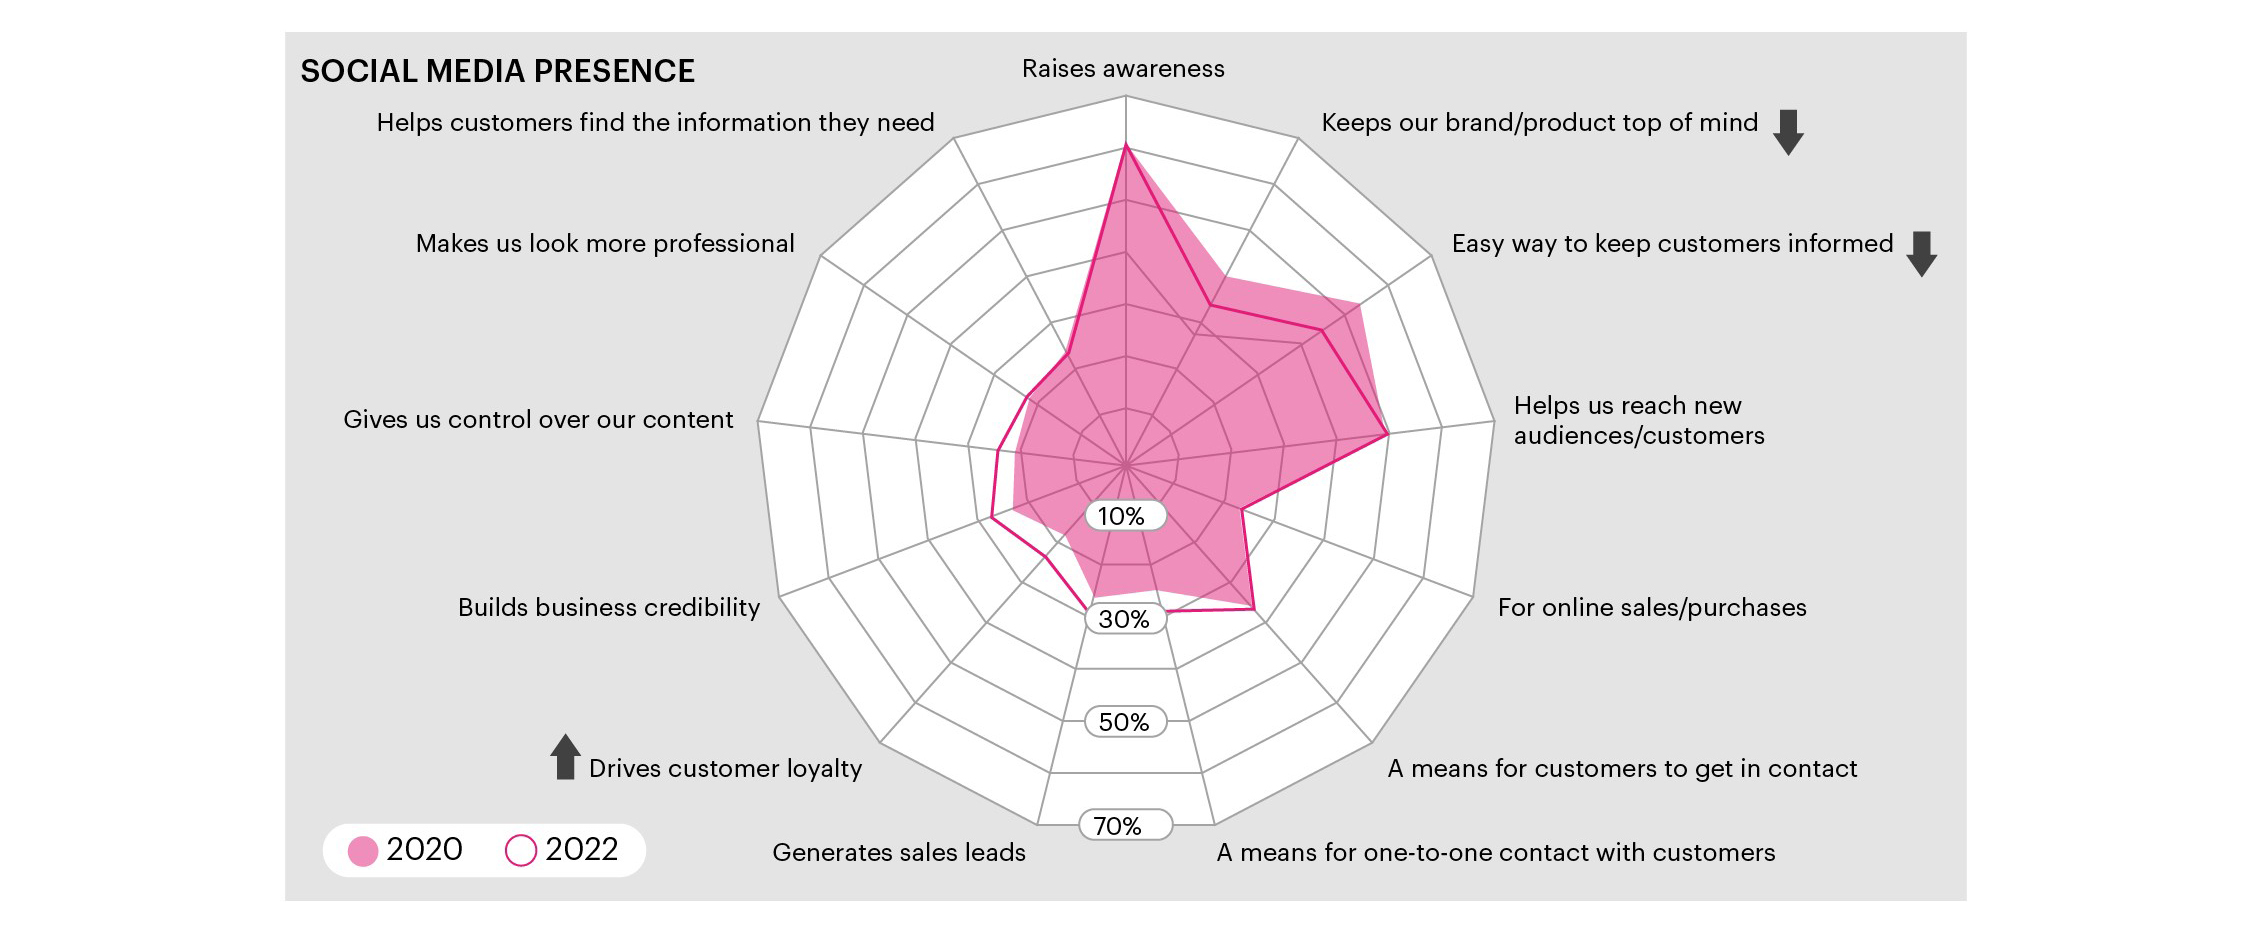
Since 2020, the footprint of websites has broadened, particularly for driving online sales. The footprint for social is strengthening in terms of loyalty and credentials. It is shrinking for saliency. Figures 3 and 4 show businesses' reasons to have websites and social media online presence.
Figure 3: businesses' reasons for having website
Businesses' reasons for having website chart description
This spider web chart shows the main reasons for having a website by businesses in 2020 and in 2022. The chart shows that the following reasons became more popular in 2022 compared to 2020:
- Helps customers find the information they need (noticeable increase)
- Gives us control over our content (noticeable increase)
- Drives customer loyalty (noticeable increase)
- For online sales/purchases (noticeable increase)
- Helps us reach new audiences/customers
- A means for customers to get in contact
The following reasons for having a website by a business stayed almost at the same level in 2020 and 2022:
- Raises awareness
- Keeps our brand/product top of mind
- Easy way to keep customers informed
- A means for one-to-one contact with customers
- Generates sales leads
- Builds business credibility
- Makes us look more professional
Figure 4: businesses' reasons for having social media
Businesses' reasons for having social media chart description
This spider web chart shows the main reasons for having social media online presence by businesses in 2020 and in 2022. The chart shows that the following reasons became more popular in 2022 compared to 2020:
- Gives us control over our content
- Builds business credibility
- Drives customer loyalty (noticeable growth)
- Generates sales leads
- A means for one-to-one contact with customers
The following reasons for having social media by a business stayed almost at the same level in 2020 and 2022:
- Raises awareness
- Helps us reach new audiences/customers
- For online sales/purchases
- A means for customers to get in contact
- Makes us look more professional
- Helps customers find the information they need
The following reasons for having social media by a business became less popular in 2022 compared to 2020:
- Keeps our brand/product top of mind (noticeable decrease)
- Easy way to keep customers informed (noticeable decrease)
Figure 4 description ends.
Comparing businesses to consumers, there is a mismatch in perceptions, with consumers placing higher importance on websites and apps for making online purchases.
Figures 5 and 6 show a comparison of the main benefits of having a website or app online presence for businesses and consumers.
Figure 5: Benefits of websites
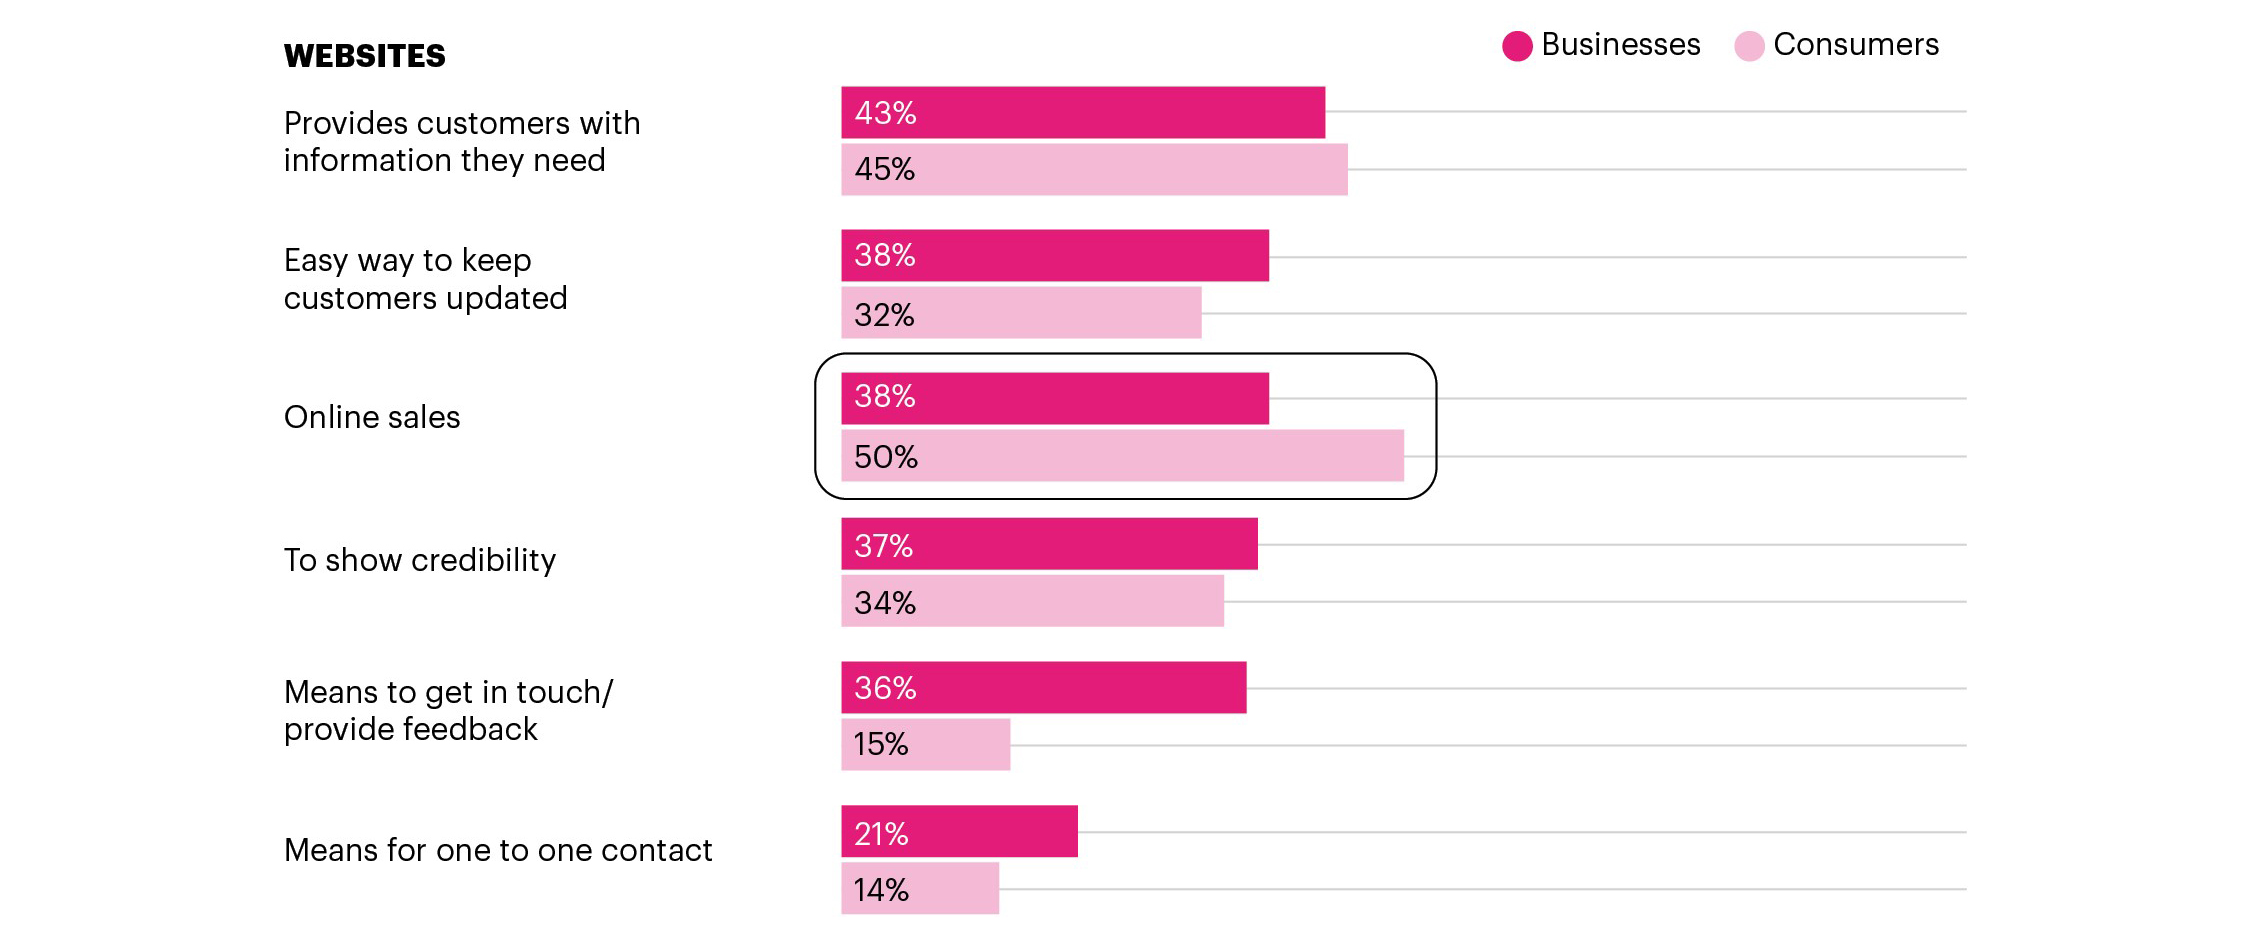
Benefits of websites chart description
The chart shows a comparison of the main benefits of websites for businesses and consumers. It shows that websites are more important to consumers than to businesses for online sales. It also shows that businesses think that websites provide people with the means to give feedback or get in touch with a business much more often than consumers.
Numerical values presented on the image:
| Benefits of websites | Businesses | Consumers |
| Provides customers with information they need | 43% | 45% |
| Easy way to keep customers updated | 38% | 32% |
| Online sales | 38% | 50% |
| To show credibility | 37% | 34% |
| Means to get in touch/ provide feedback | 36% | 15% |
| Means for one to one contact | 21% | 14% |
Figure 6: benefits of apps
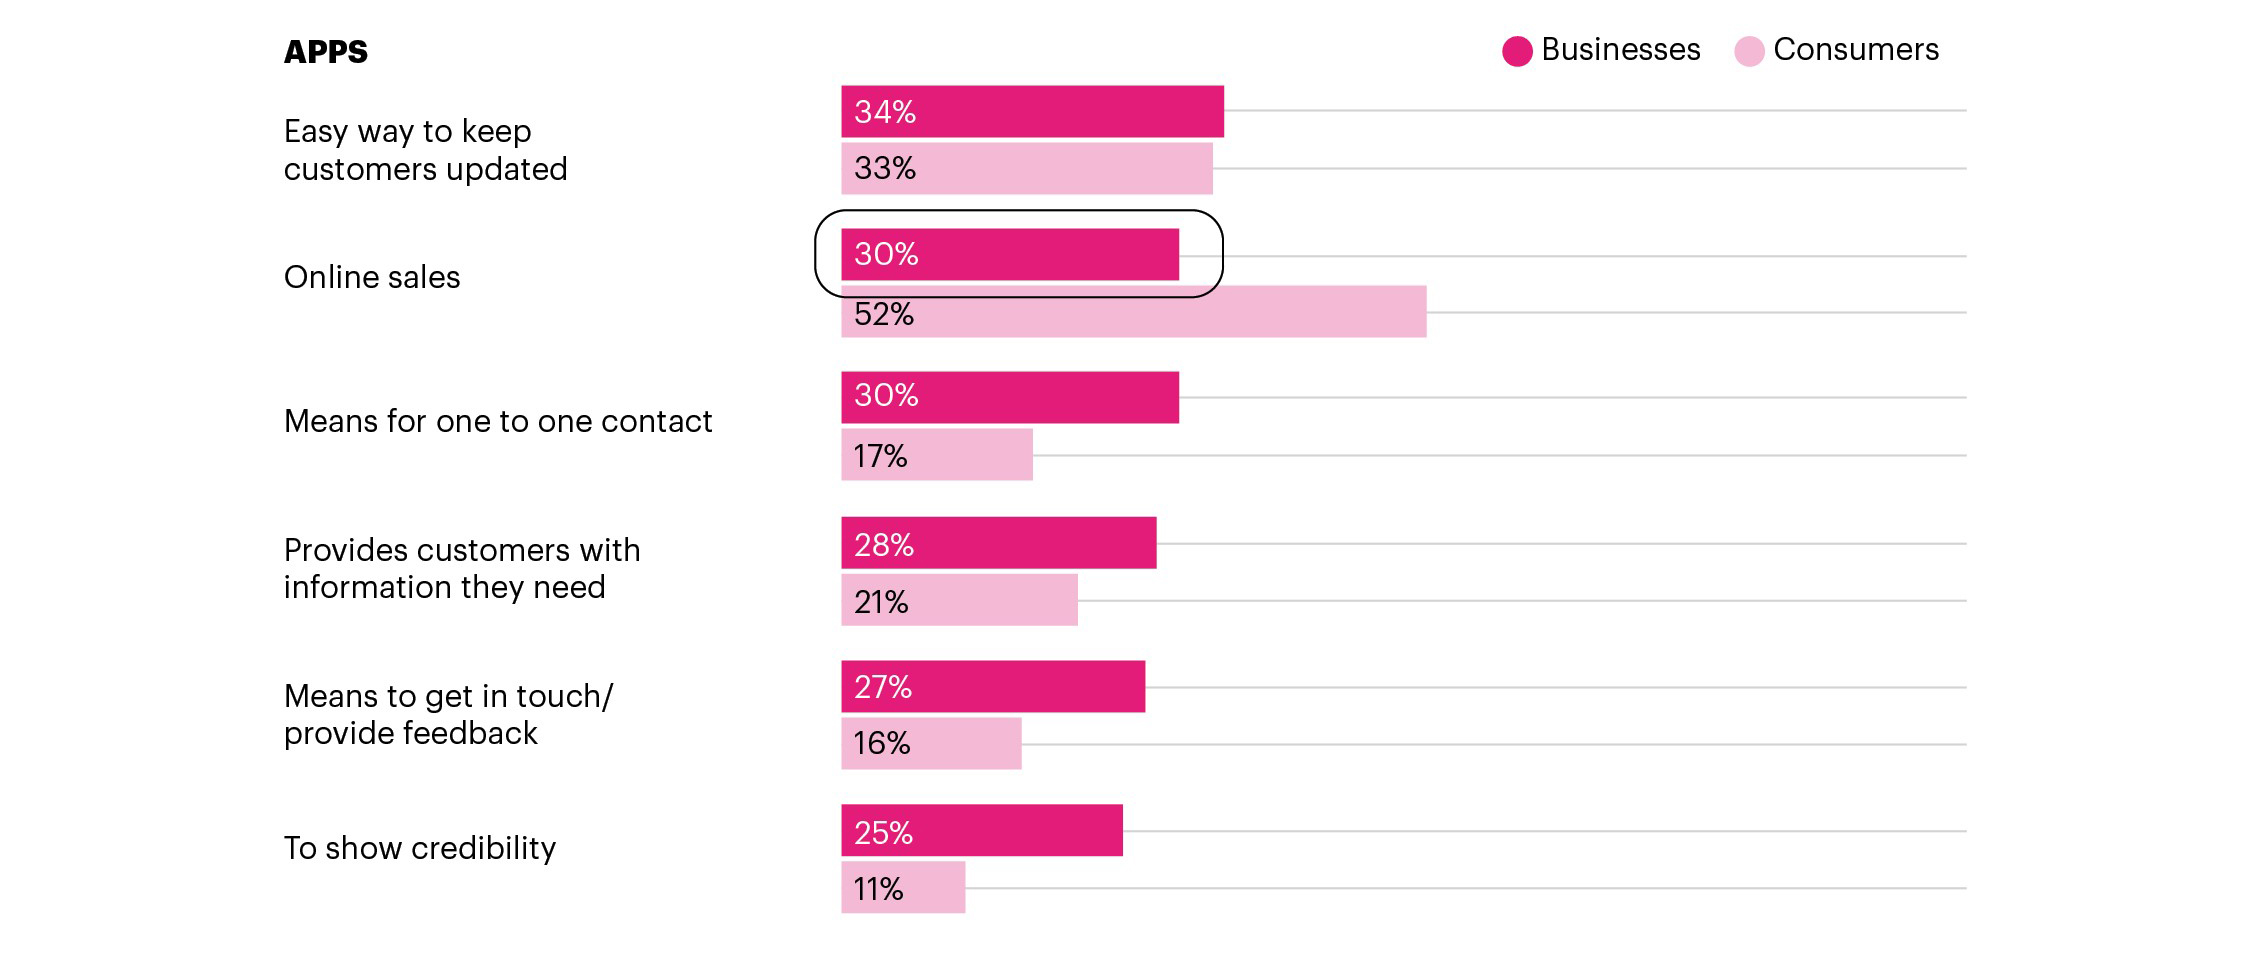
Benefits of apps chart description
The chart shows a comparison of the main benefits of apps for businesses and consumers. It shows that apps are more important to consumers than to businesses for online sales. It also shows that businesses put more importance than consumers on apps as means for contact, providing feedback and showing credibility.
Numerical values presented on the image:
| Benefits of apps | Businesses | Consumers |
| Easy way to keep customers updated | 34% | 33% |
| Online sales | 30% | 52% |
| Means for one to one contact | 30% | 17% |
| Provides customers with information they need | 28% | 21% |
| Means to get in touch/ provide feedback | 27% | 16% |
| To show credibility | 25% | 11% |
Figure 6 description ends.
Consumers are also more likely to rate marketplaces higher than businesses indicating there is some untapped potential in this space.
Figure 7: benefits of marketplaces
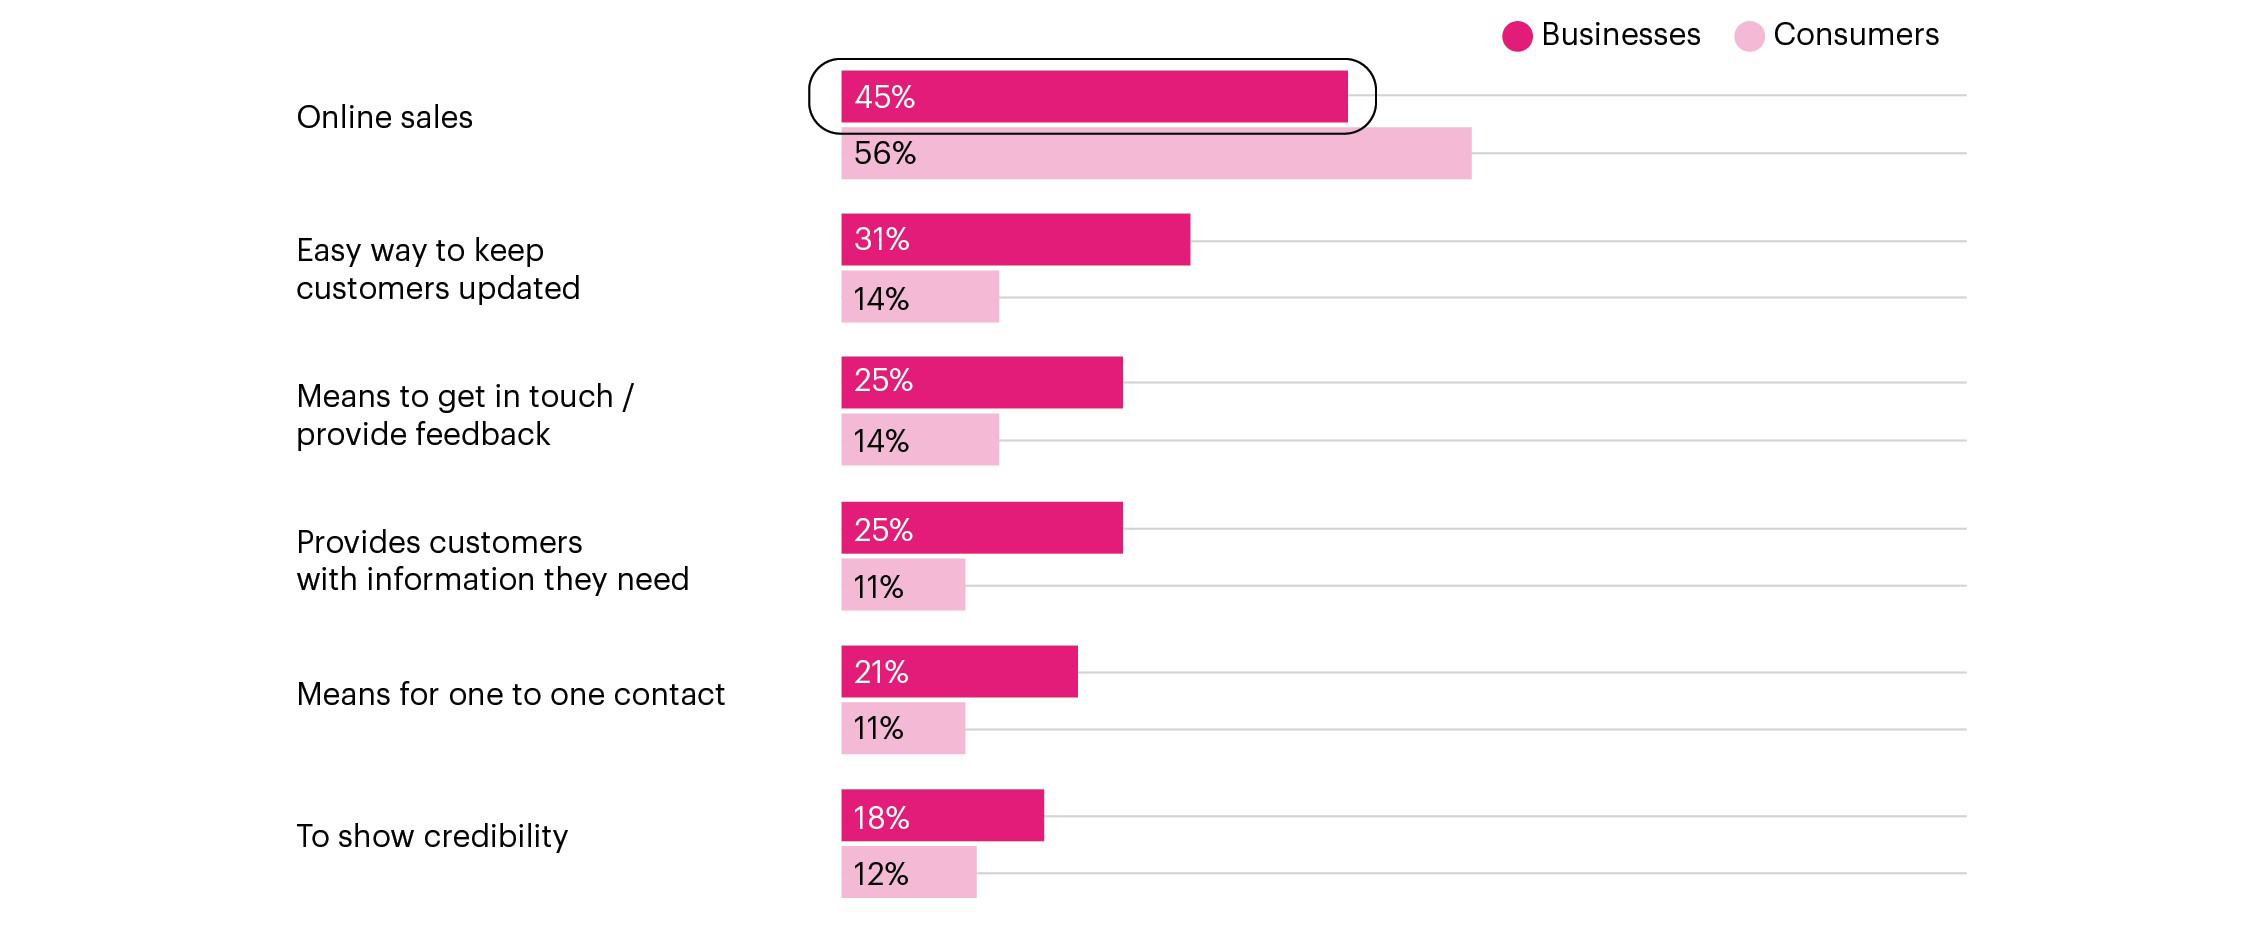
Benefits of marketplaces chart description
The chart shows a comparison of the main benefits of marketplaces for businesses and consumers. It shows that consumers rate marketplaces higher than businesses for online sales purposes. It also shows that businesses put more importance than consumers on marketplaces as means to keep customers updated and provide them with the information they need, as well as for contact and providing feedback.
Numerical values presented on the image:
| Benefits of marketplaces | Businesses | Consumers |
| Online sales | 45% | 56% |
| Easy way to keep customers updated | 31% | 14% |
| Means to get in touch/ provide feedback | 25% | 14% |
| Provides customers with information they need | 25% | 11% |
| Means for one to one contact | 21% | 11% |
| To show credibility | 18% | 12% |
Figure 7 description ends.
For email, consumers rate the benefits of one-to-one contact and a means to get in touch much lower than businesses.
Figure 8: benefits of email
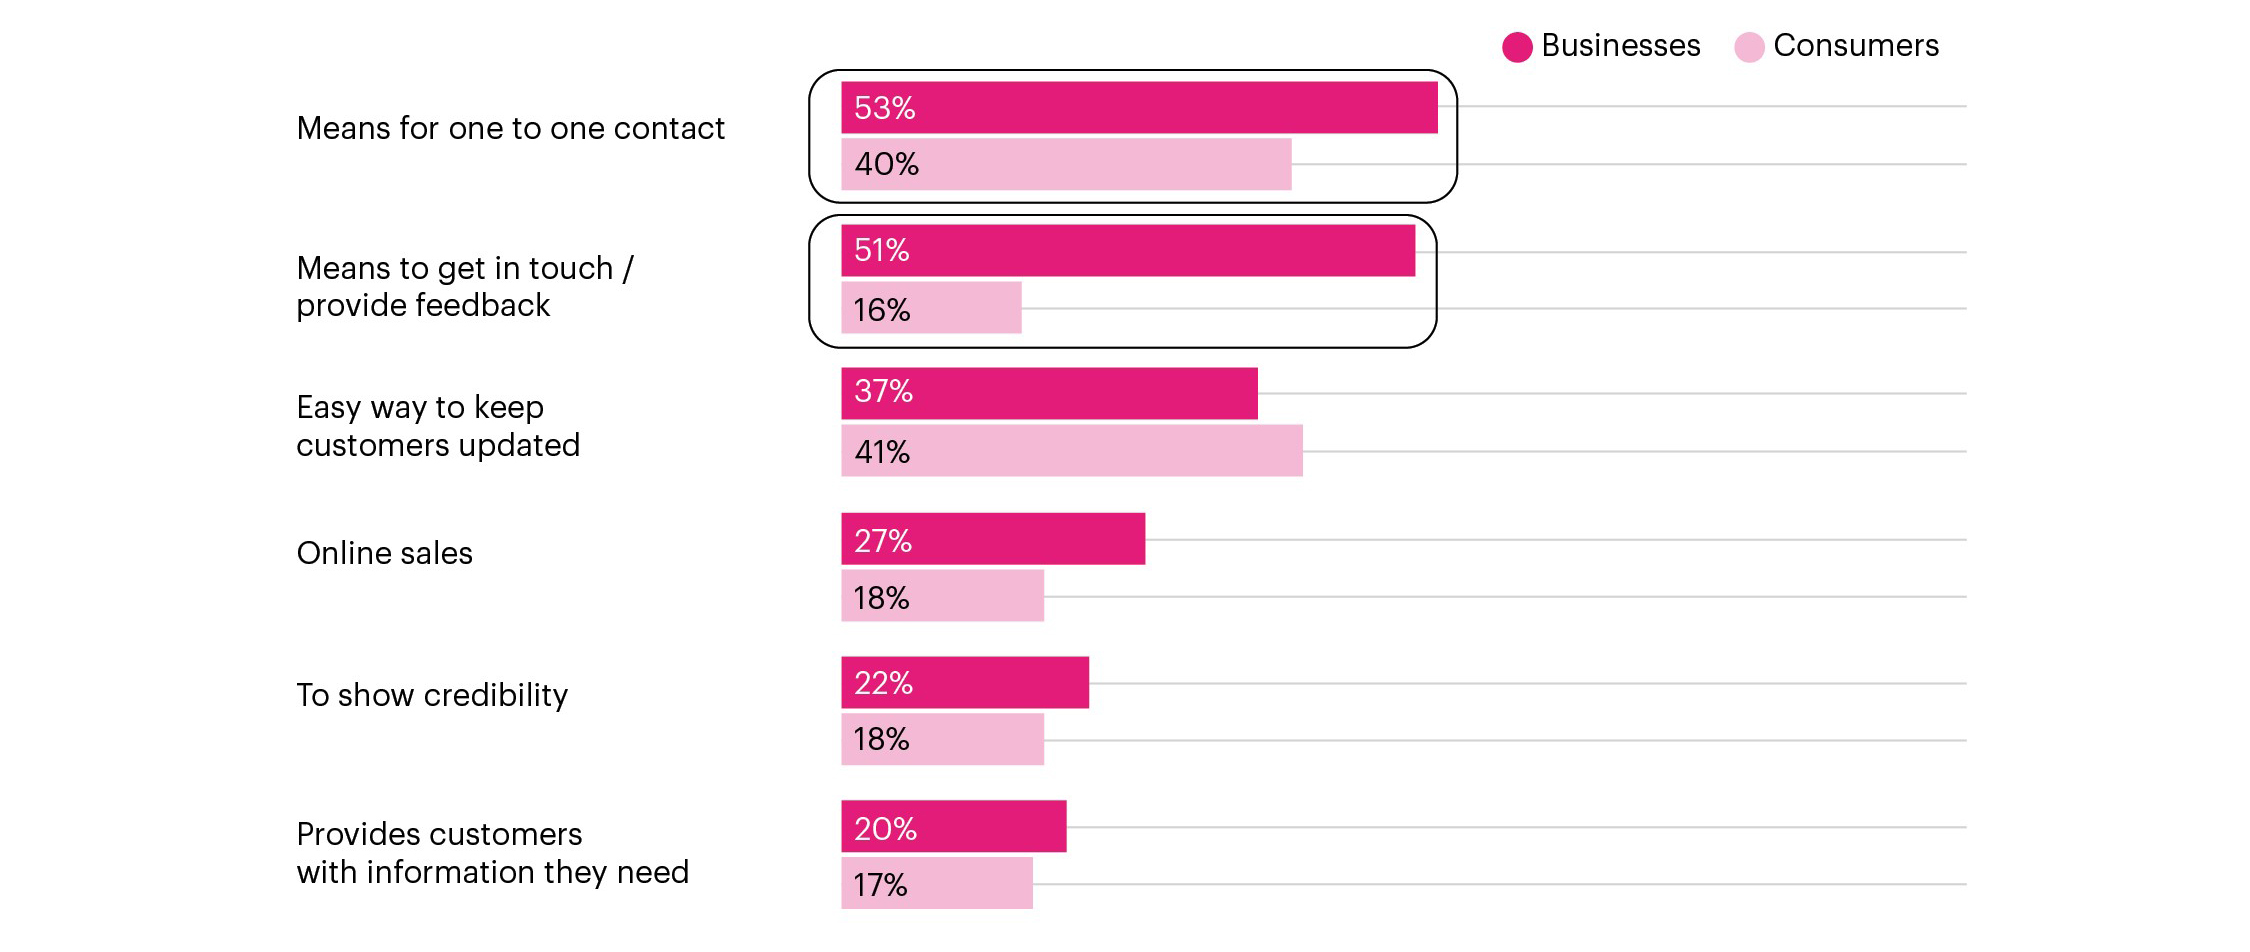
Benefits of email chart description
The chart shows a comparison of the main benefits of email for businesses and consumers. It shows that businesses rate email higher than consumers as a means for one-to-one contact, getting in touch and providing feedback.
Numerical values presented on the image:
| Benefits of marketplaces | Businesses | Consumers |
| Means for one to one contact | 53% | 40% |
| Means to get in touch/ provide feedback | 51% | 16% |
| Easy way to keep customers updated | 37% | 41% |
| Online sales | 27% | 18% |
| To show credibility | 22% | 18% |
| Provides customers with information they need | 20% | 17% |
Domain names awareness and use
Unchanged over time, 88% of businesses are aware of what a domain name is…while among consumers, there has been a small decline in domain name awareness from 2020.
Figure 9: domain name awareness
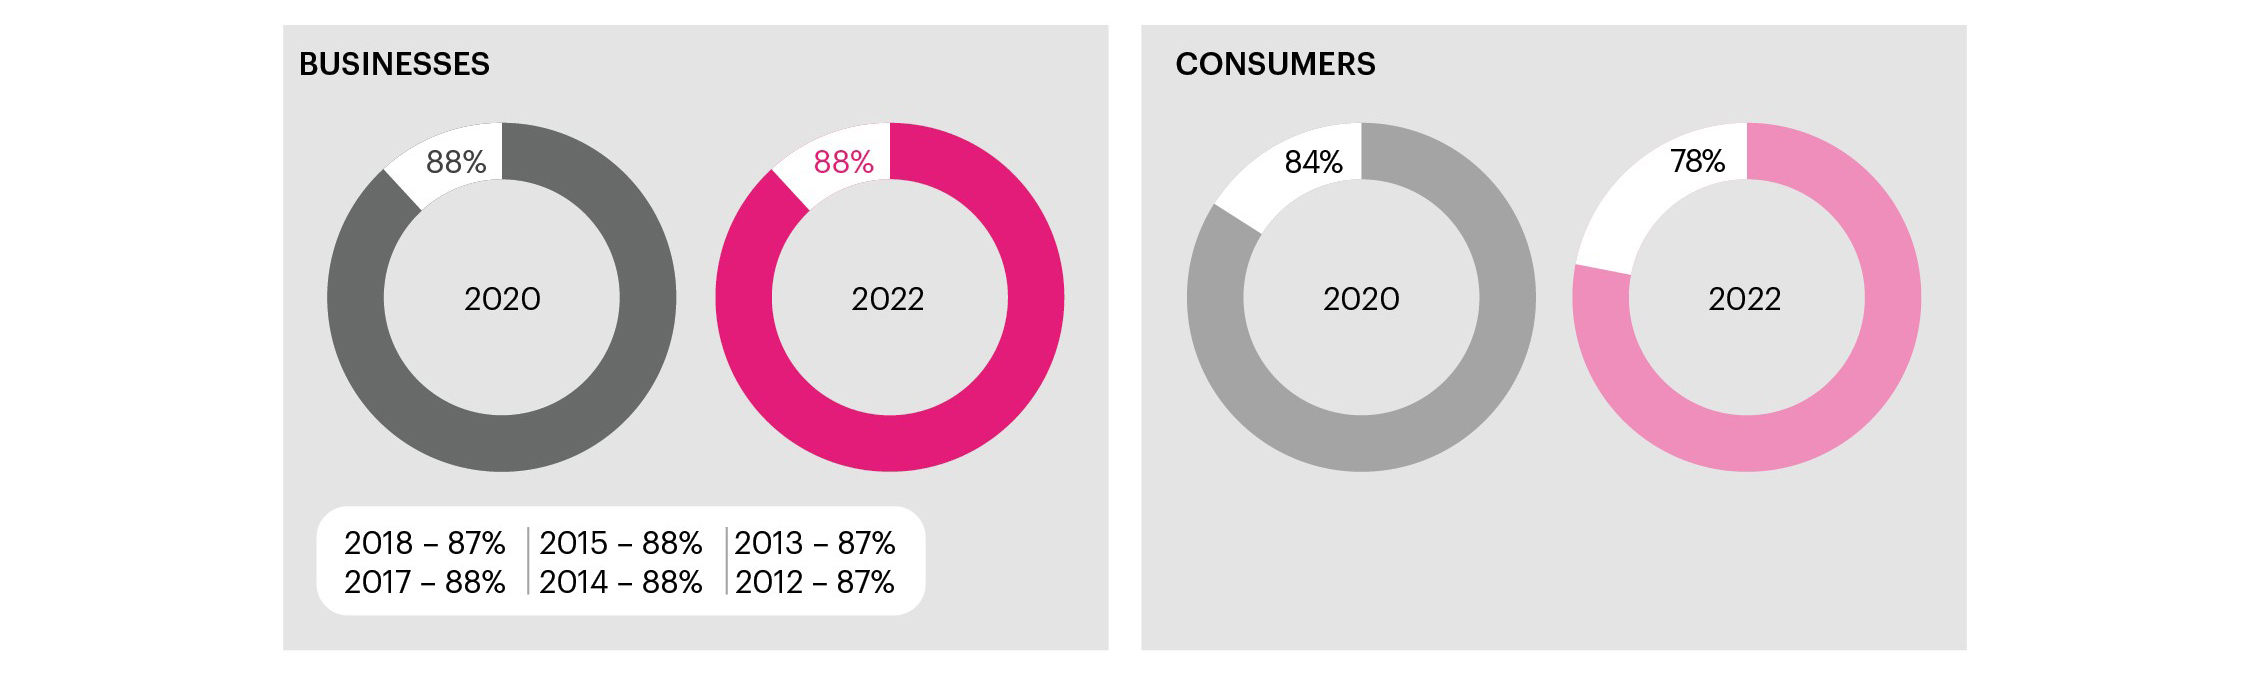
Domain names awareness chart description
This pie chart shows how aware are businesses and consumers of what a domain name is. It shows that consumers' awareness has slightly decreased from 84% in 2020 to 78% in 2022. It also shows that the businesses' awareness of what a domain name has stayed at the same level of 87-88% for the last 10 years.
Numerical values presented on the image:
| Year | Level of domain name awareness - businesses | Level of domain name awareness - consumers |
| 2022 | 88% | 78% |
| 2020 | 88% | 84% |
| 2018 | 87% | not available |
| 2017 | 88% | not available |
| 2015 | 88% | not available |
| 2014 | 88% | not available |
| 2013 | 87% | not available |
| 2012 | 87% | not available |
Figure 9 description ends.
Similar to 2020, just under two-thirds of businesses said they own or manage a domain name, while an increasing number of consumers have a personal domain name (up from 17% in 2020).
Figure 10: domain name ownership or management
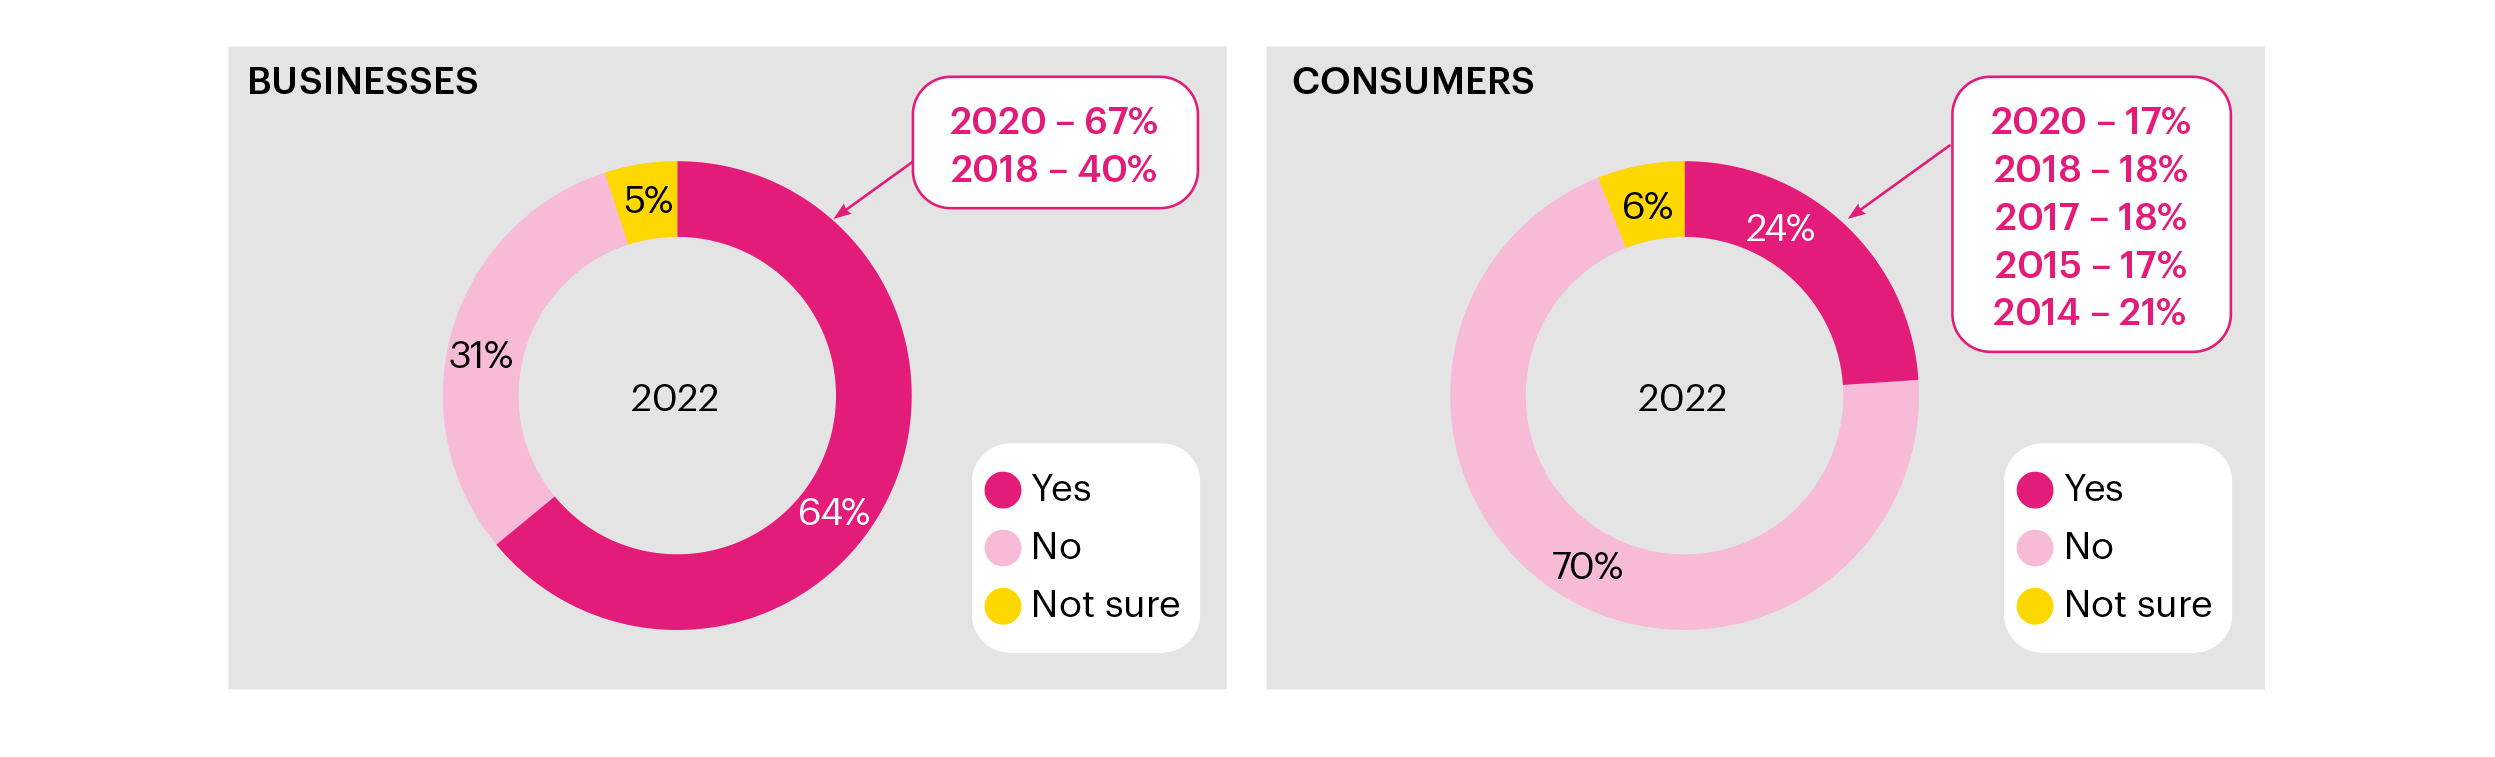
Domain name ownership or management chart description
This pie chart shows how many businesses and consumers own or manage a domain name over time. It shows that almost two-thirds of businesses say they own or manage a domain name both in 2020 and 2022. It is significant growth from 2018 when only 40% of businesses said they own or manage a domain. The chart shows the number of consumers who own or manage a domain stayed at the same level of 17-18% from 2015-2020. However, 24% of consumers own a domain in 2022.
Numerical values presented on the image:
| Year | Businesses own or manage a domain | Consumers own or manage a domain |
| 2022 | 64% | 24% |
| 2020 | 67% | 17% |
| 2018 | 40% | 18% |
| 2017 | not available | 18% |
| 2015 | not available | 17% |
| 2014 | not available | 21% |
| Businesses | Consumers | |
| Not own or manage a domain in 2022 | 31% | 70% |
| Not sure whether they own or manage a domain name in 2022 | 5% | 6% |
Figure 11: consumers' reasons for owning a domain/domains
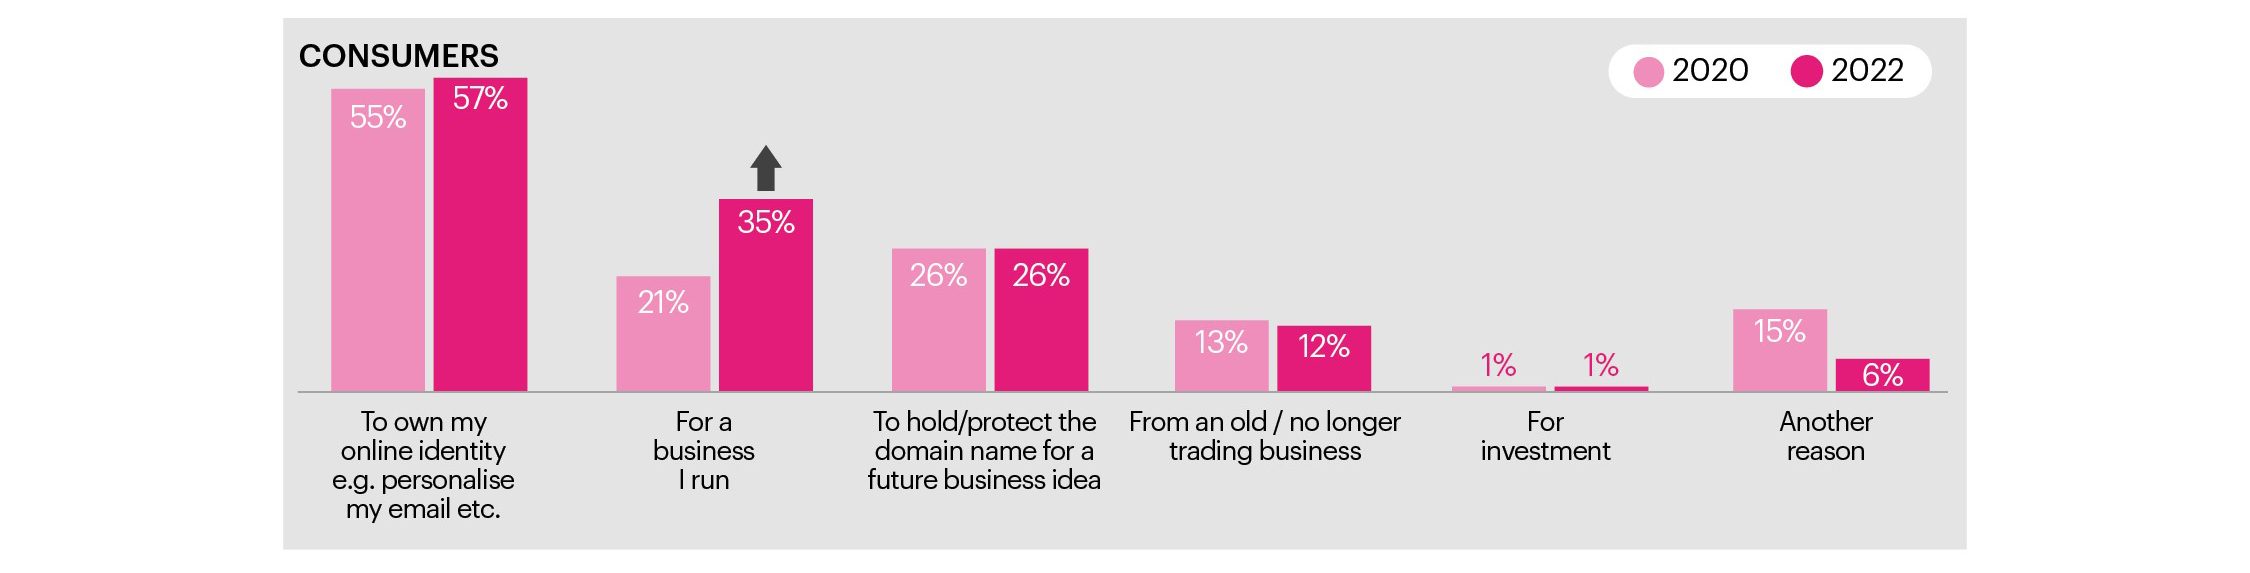
Consumers' reasons for owning a domain/domains chart description
This column chart shows consumers' reasons for owning a domain/domains in 2020 and 2022. It shows that significantly more consumers own a domain for a business they run in 2022 than in 2020. Other reasons to own a domain stay approximately at the same level.
Numerical values presented on the image:
| Consumers' reason for owning a domain | 2020 | 2022 |
| To own my online identity e.g. personalise my email etc. | 55% | 57% |
| For a business I run | 21% | 35% |
| To hold/protect the domain name for a future business idea | 26% | 26% |
| From an old / no longer trading business | 13% | 12% |
| For investment | 1% | 1% |
| Another reason | 15% | 6% |
Figure 12: domain names use by consumers
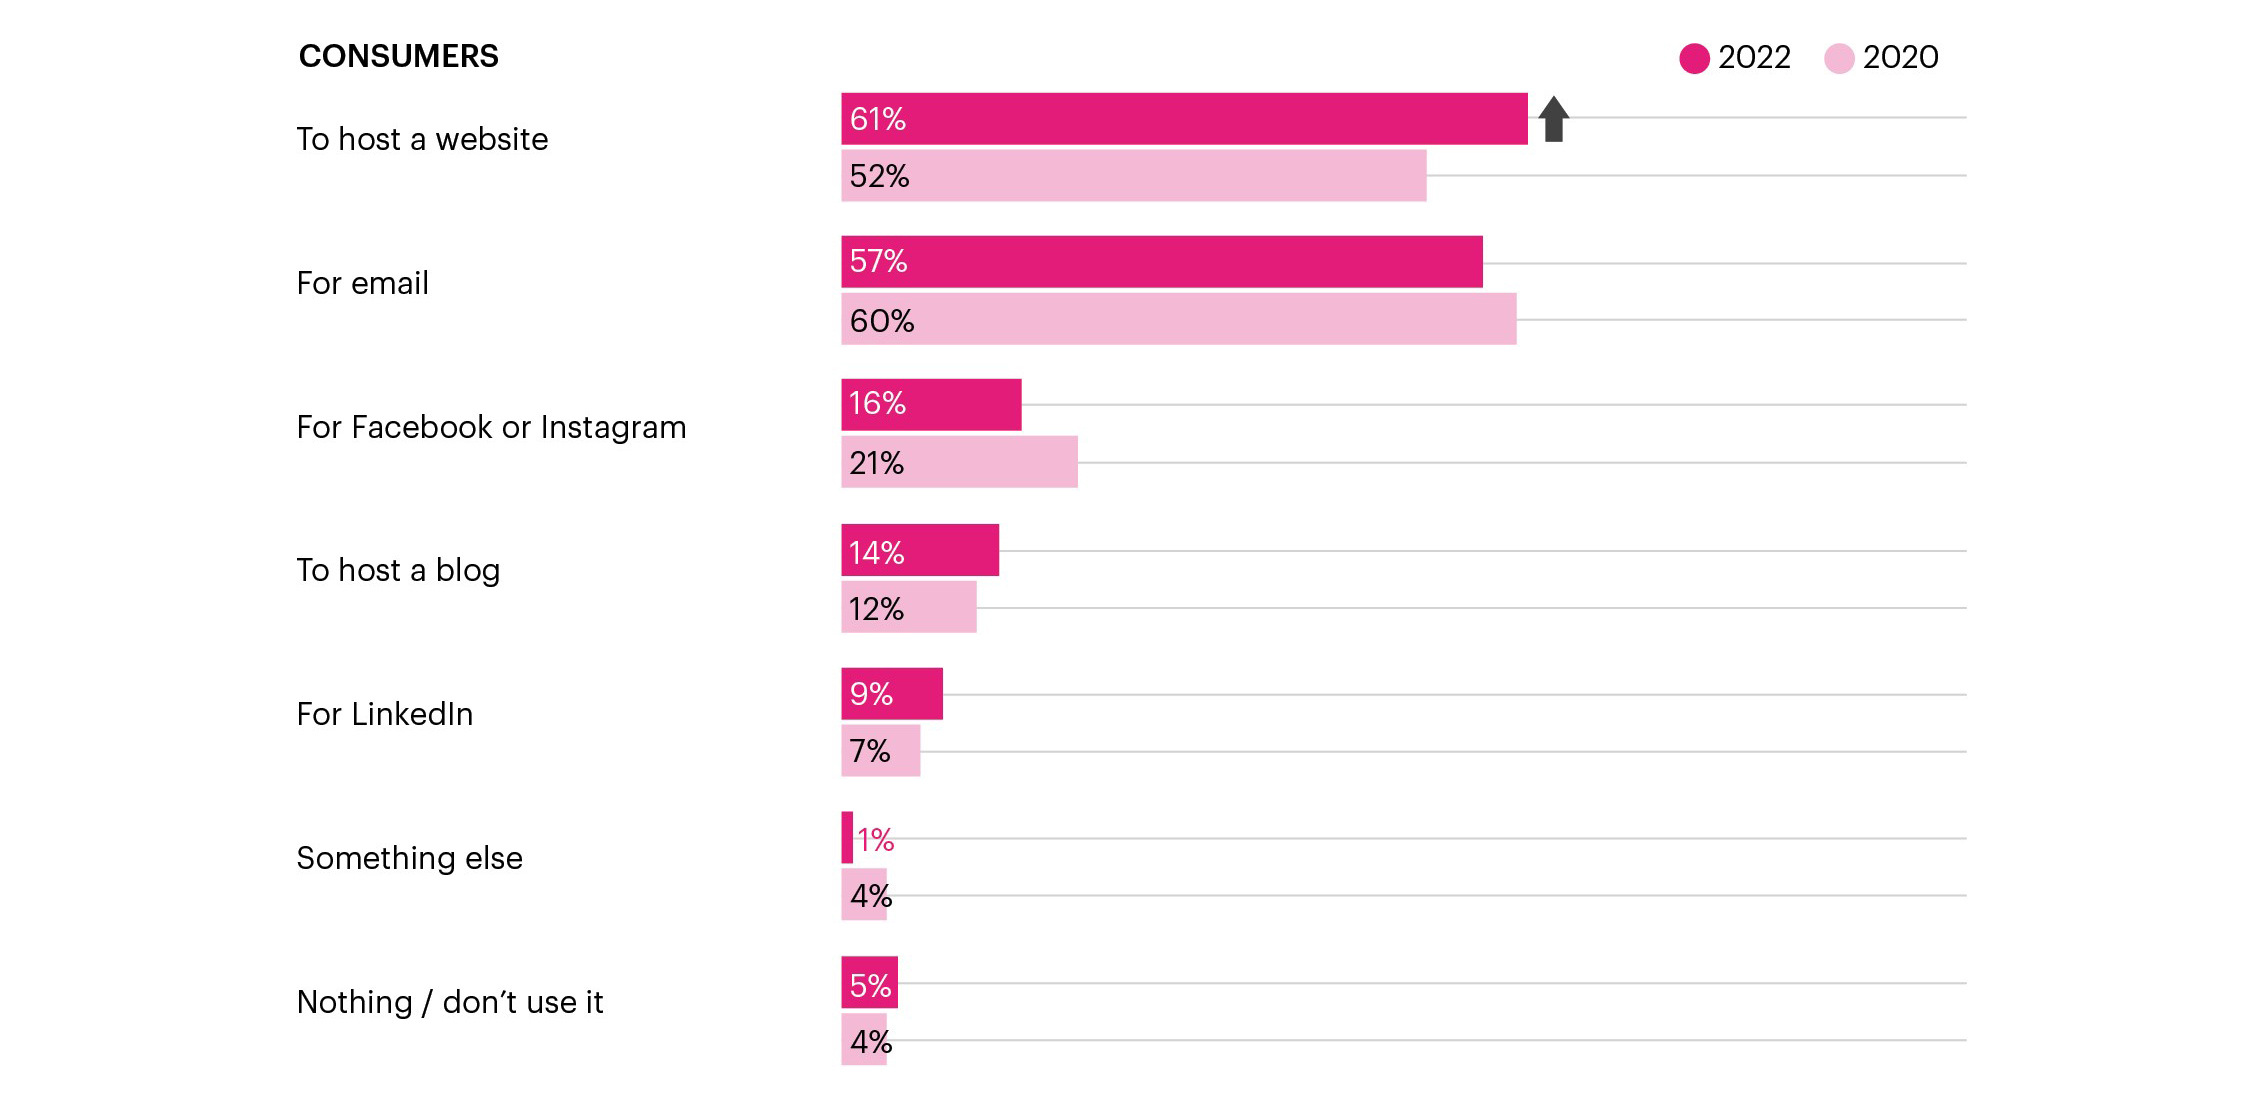
Domain names use by consumers chart description
This bar chart shows comparison of domain names use by consumers in 2020 and 2022. It shows that 'hosting a website' and 'for email' are the most popular uses for a domain name. The chart also shows that more consumers use their domain name to host a website in 2022 than in 2020.
Numerical values presented on the image:
| Domain name use | 2020 | 2022 |
| To host a website | 52% | 61% |
| For email | 60% | 57% |
| For Facebook or Instagram | 21% | 16% |
| To host a blog | 12% | 14% |
| For LinkedIn | 7% | 9% |
| Something else | 4% | 1% |
| Nothing / don’t use it | 4% | 5% |
Figure 13: Businesses' triggers to register a domain name
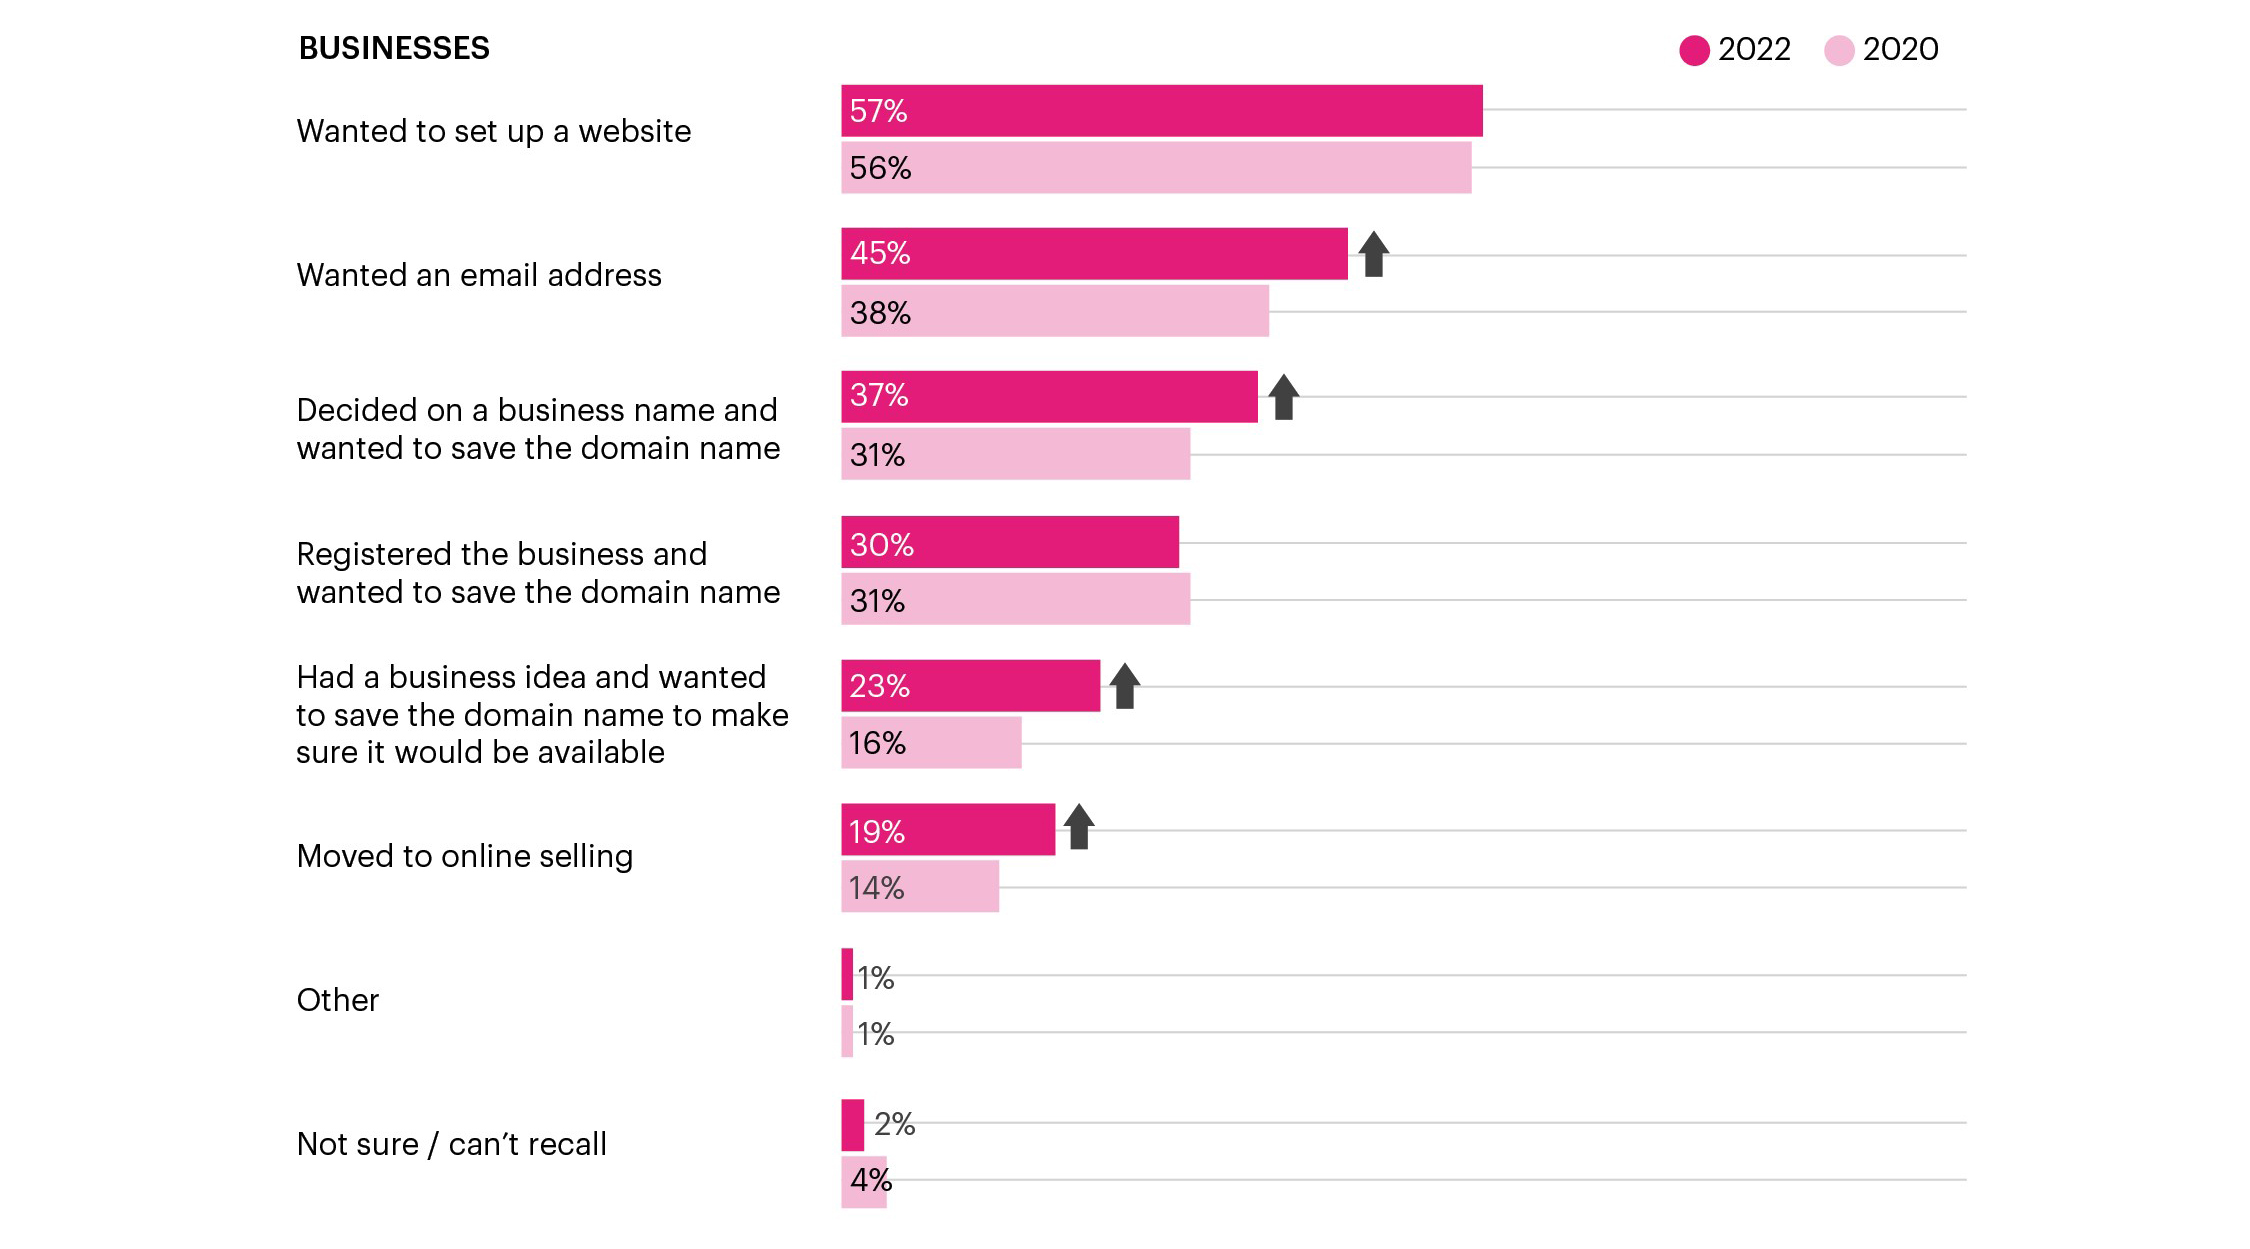
Businesses' triggers to register a domain name chart description
This bar chart shows a comparison of triggers that led businesses to a decision to register a domain name in 2020 and 2022. It shows that in 2022 businesses decided to register a domain name more often than in 2020 when they wanted to have an email address, or wanted to reserve a domain name for a future business idea, or moved to online selling.
Numerical values presented on the image:
| Trigger to register a domain name | 2020 | 2022 |
| Wanted to set up a website | 56% | 57% |
| Wanted an email address | 38% | 45% |
| Decided on a business name and wanted to save the domain name | 31% | 37% |
| Registered the business and wanted to save the domain name | 31% | 30% |
| Had a business idea and wanted to save the domain name to make sure it would be available | 16% | 23% |
| Moved to online selling | 14% | 19% |
| Other | 1% | 1% |
| Not sure / can’t recall | 4% | 2% |
.nz domain ownership
Figure 14: domain name ownership
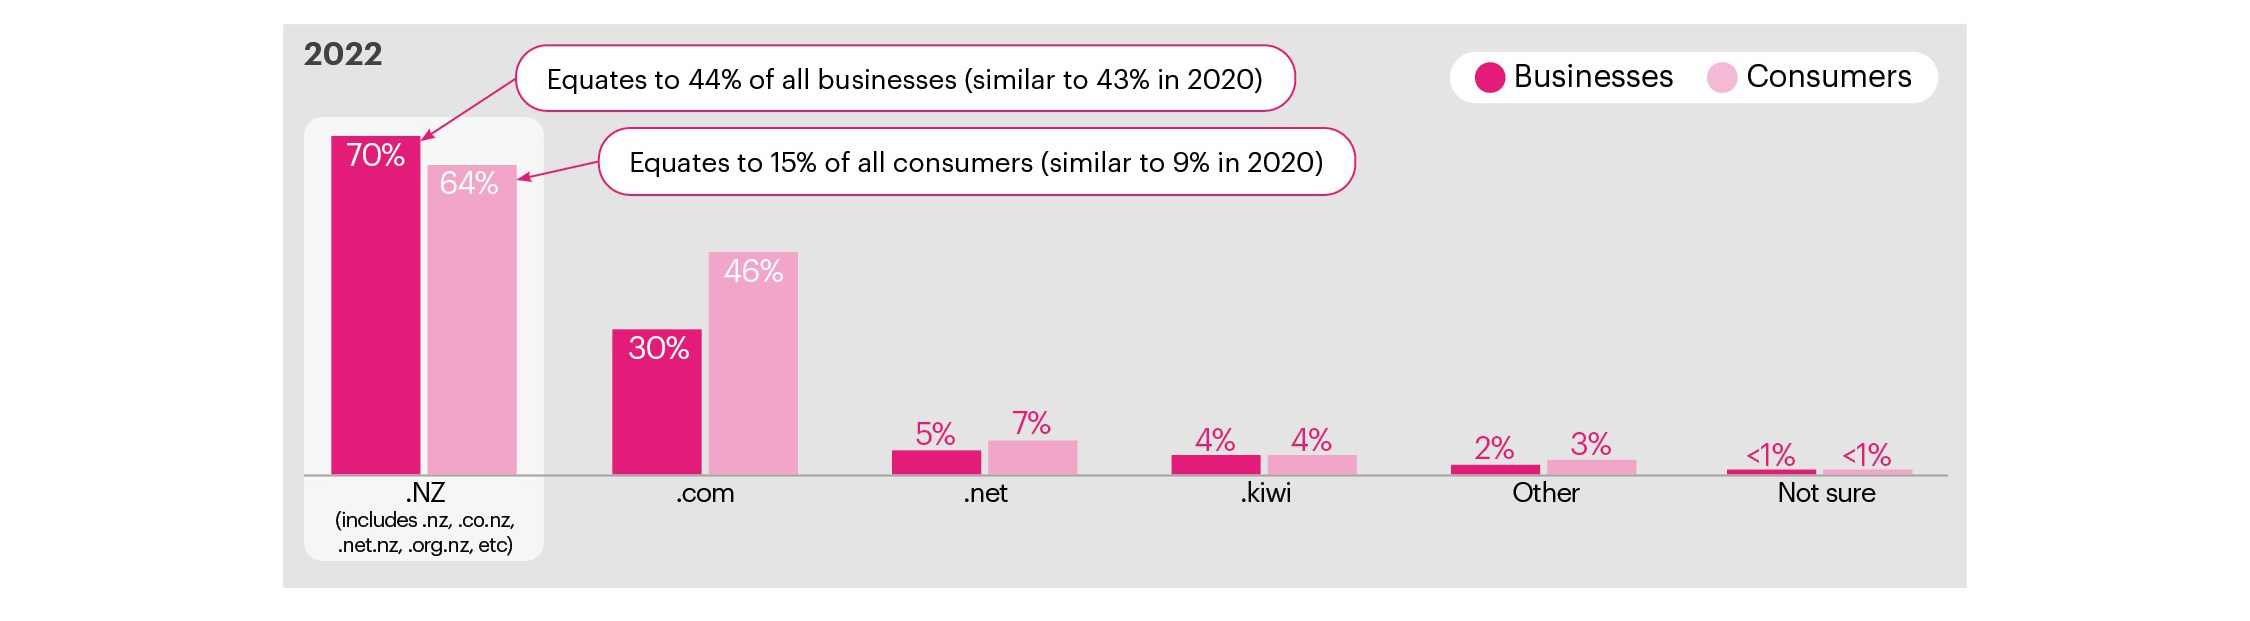
Domain name ownership chart description
This vertical bar chart shows a comparison of types of domain names businesses and consumers in New Zealand use/own. It shows that among those who own a domain, 70% of businesses and 64% of consumers have a .nz domain. It equates to 44% of all businesses and 15% of all consumers in New Zealand owning a .nz domain in 2022. These numbers are also close to the domain name ownership data from 2020.
The chart shows that the second most popular domain name type is .com. Other types of domains, such as .net, .kiwi and other, are significantly less popular among New Zealanders.
Numerical values presented on the image:
| Type of a domain name use/own | Businesses | Consumers |
| .nz (includes .nz, .co.nz, .net.nz, .org.nz, etc.) | 70% Equates to 44% of all businesses (similar to 43% in 2020) |
64% Equates to 15% of all consumers (similar to 9% in 2020) |
| .com | 30% | 46% |
| .net | 5% | 7% |
| .kiwi | 4% | 4% |
| Other | 2% | 3% |
| Not sure | <1% | <1% |
Perceptions of .nz
Figure 15: perceptions of .nz: value
Extent of agreement that the .nz domain name is more valuable/ offers more value than other domain names.
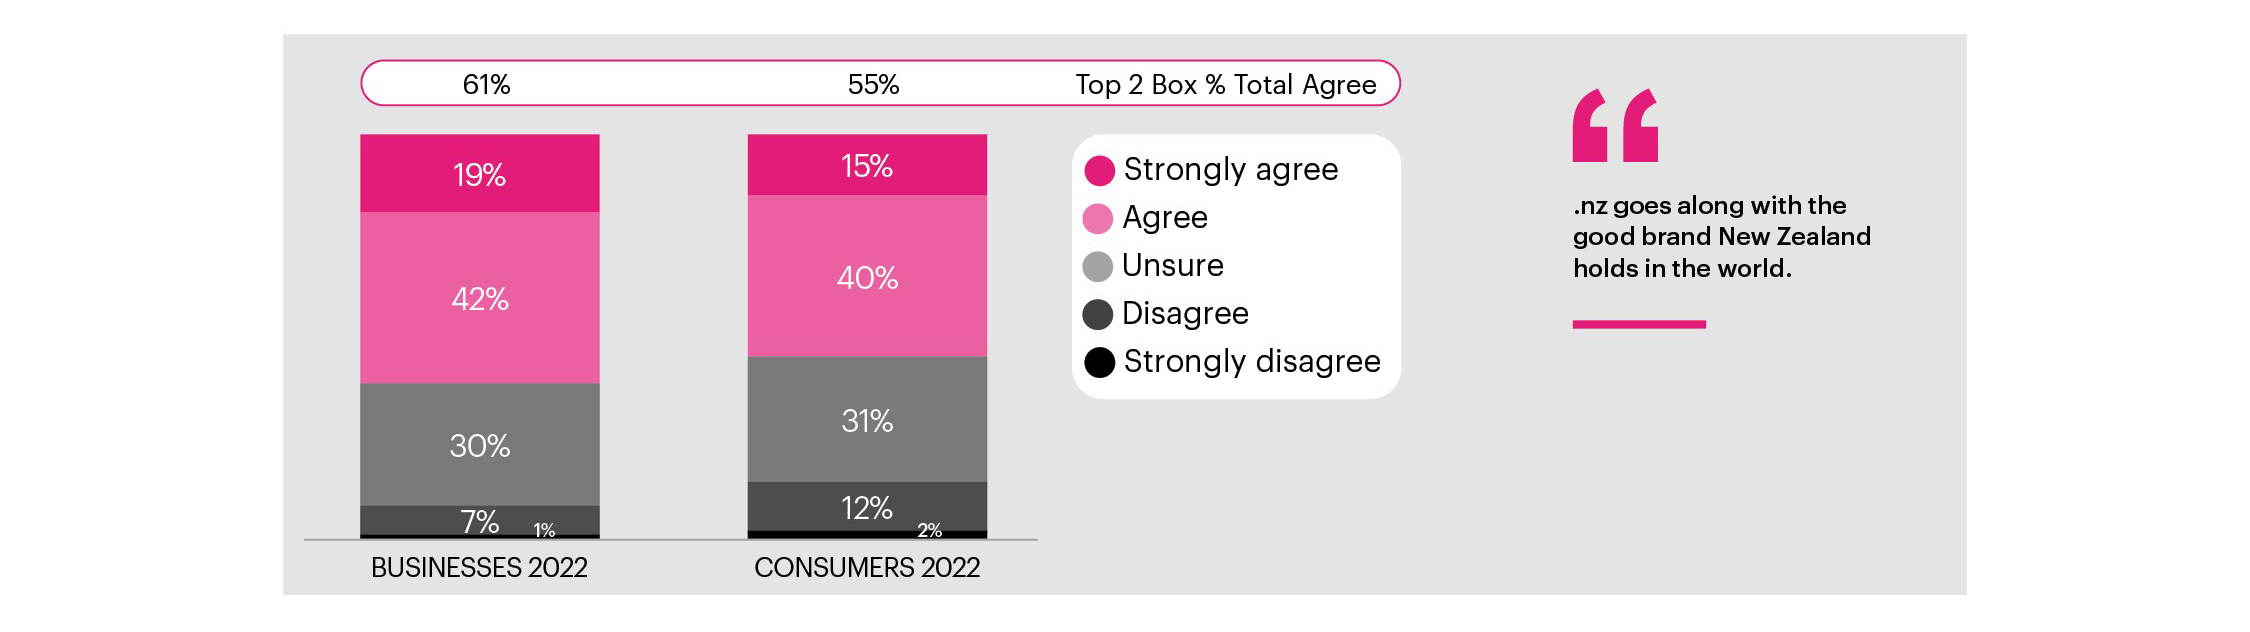
Perceptions of .nz: value chart description
This chart shows the extent of agreement that the .nz domain name is more valuable/ offers more value than other domain names for businesses and consumers. It shows that in 2022, 6 in 10 businesses and just over half of consumers agree that .nz domain names are more valuable than other domain names.
One of the research respondents is quoted in the image, saying, '.nz goes along with the good brand New Zealand holds in the world.'
Numerical values presented on the image:
| Extent of agreement that the .nz domain name is more valuable/ offers more value than other domain names | Businesses | Consumers |
| Strongly agree | 19% | 15% |
| Agree | 42% | 40% |
| Unsure | 30% | 31% |
| Disagree | 7% | 12% |
| Strongly disagree | 1% | 2% |
Figure 16: perceptions of .nz: trust
Extent of agreement that the .nz domain name is more trustworthy than other domain names.
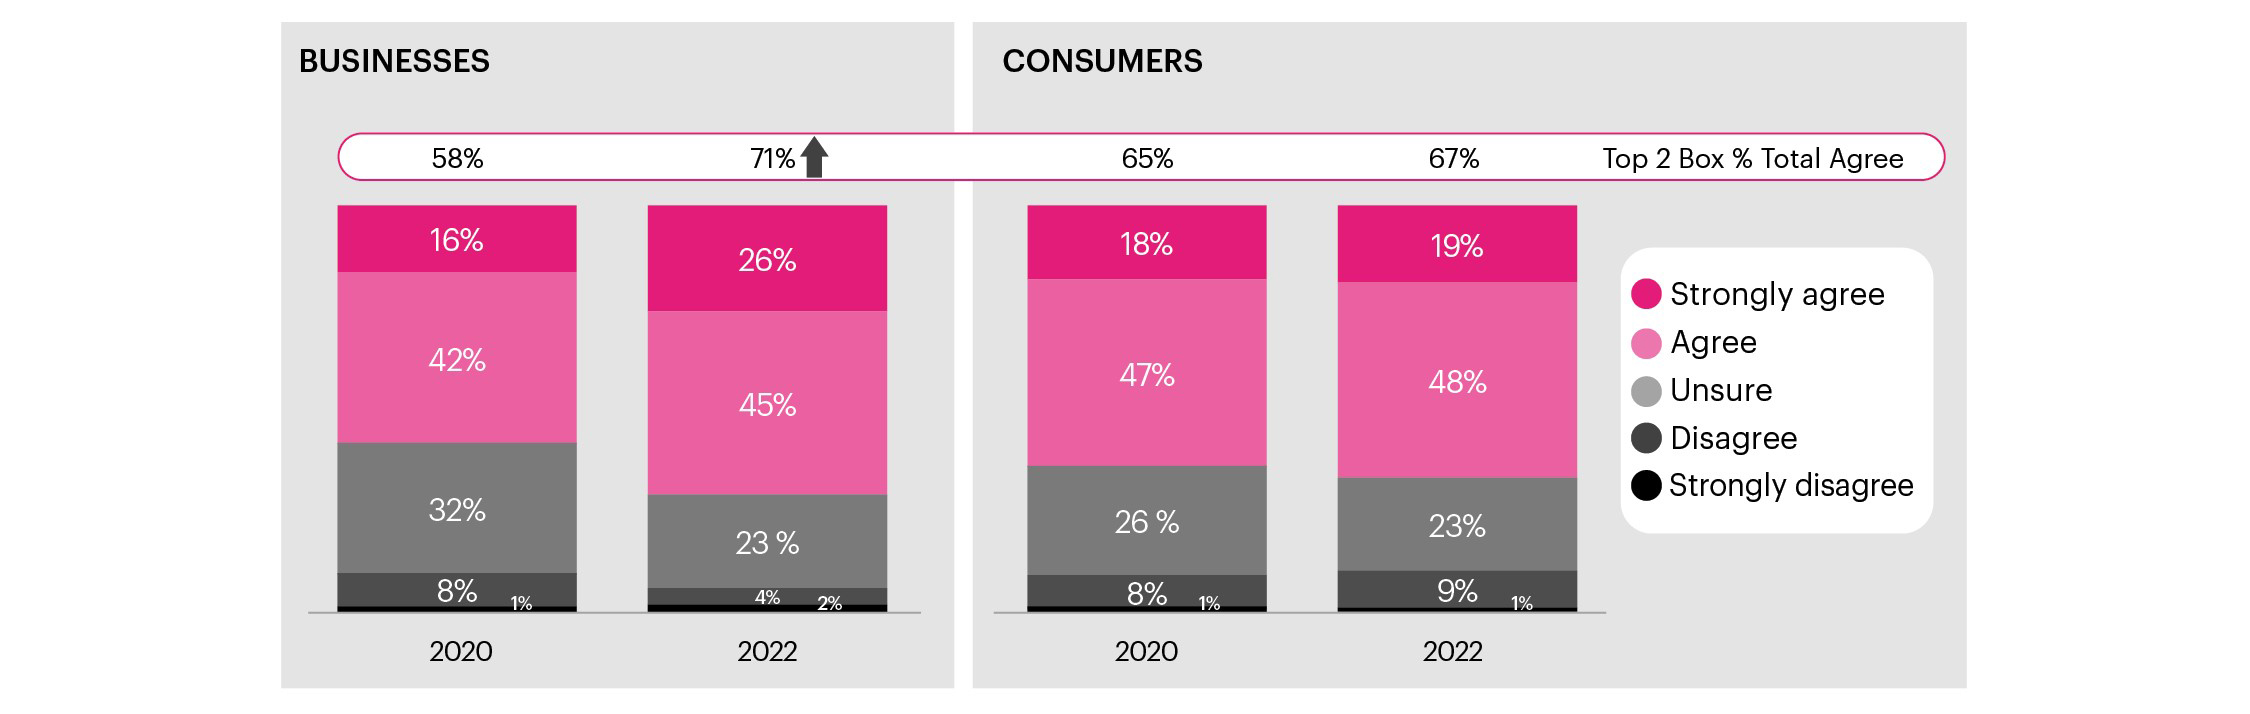
Perceptions of .nz: trust chart description
This chart shows the extent of agreement that the .nz domain name is more trustworthy than other domain names for businesses and consumers. The data is available for 2020 and 2022. It shows an increase in businesses in 2022 that feel that .nz is more trustworthy than other domain names. It also shows the overall high level of trust in .nz domain names among businesses and consumers.
Numerical values presented on the image:
| Extent of agreement that the .nz domain name is more trustworthy than other domain names | Businesses 2020 | Businesses 2022 | Consumers 2020 | Consumers 2022 |
| Strongly agree | 16% | 26% | 18% | 19% |
| Agree | 42% | 45% | 47% | 48% |
| Unsure | 32% | 23% | 26% | 23% |
| Disagree | 8% | 4% | 8% | 9% |
| Strongly disagree | 1% | 2% | 1% | 1% |
Figure 17: online search behaviour
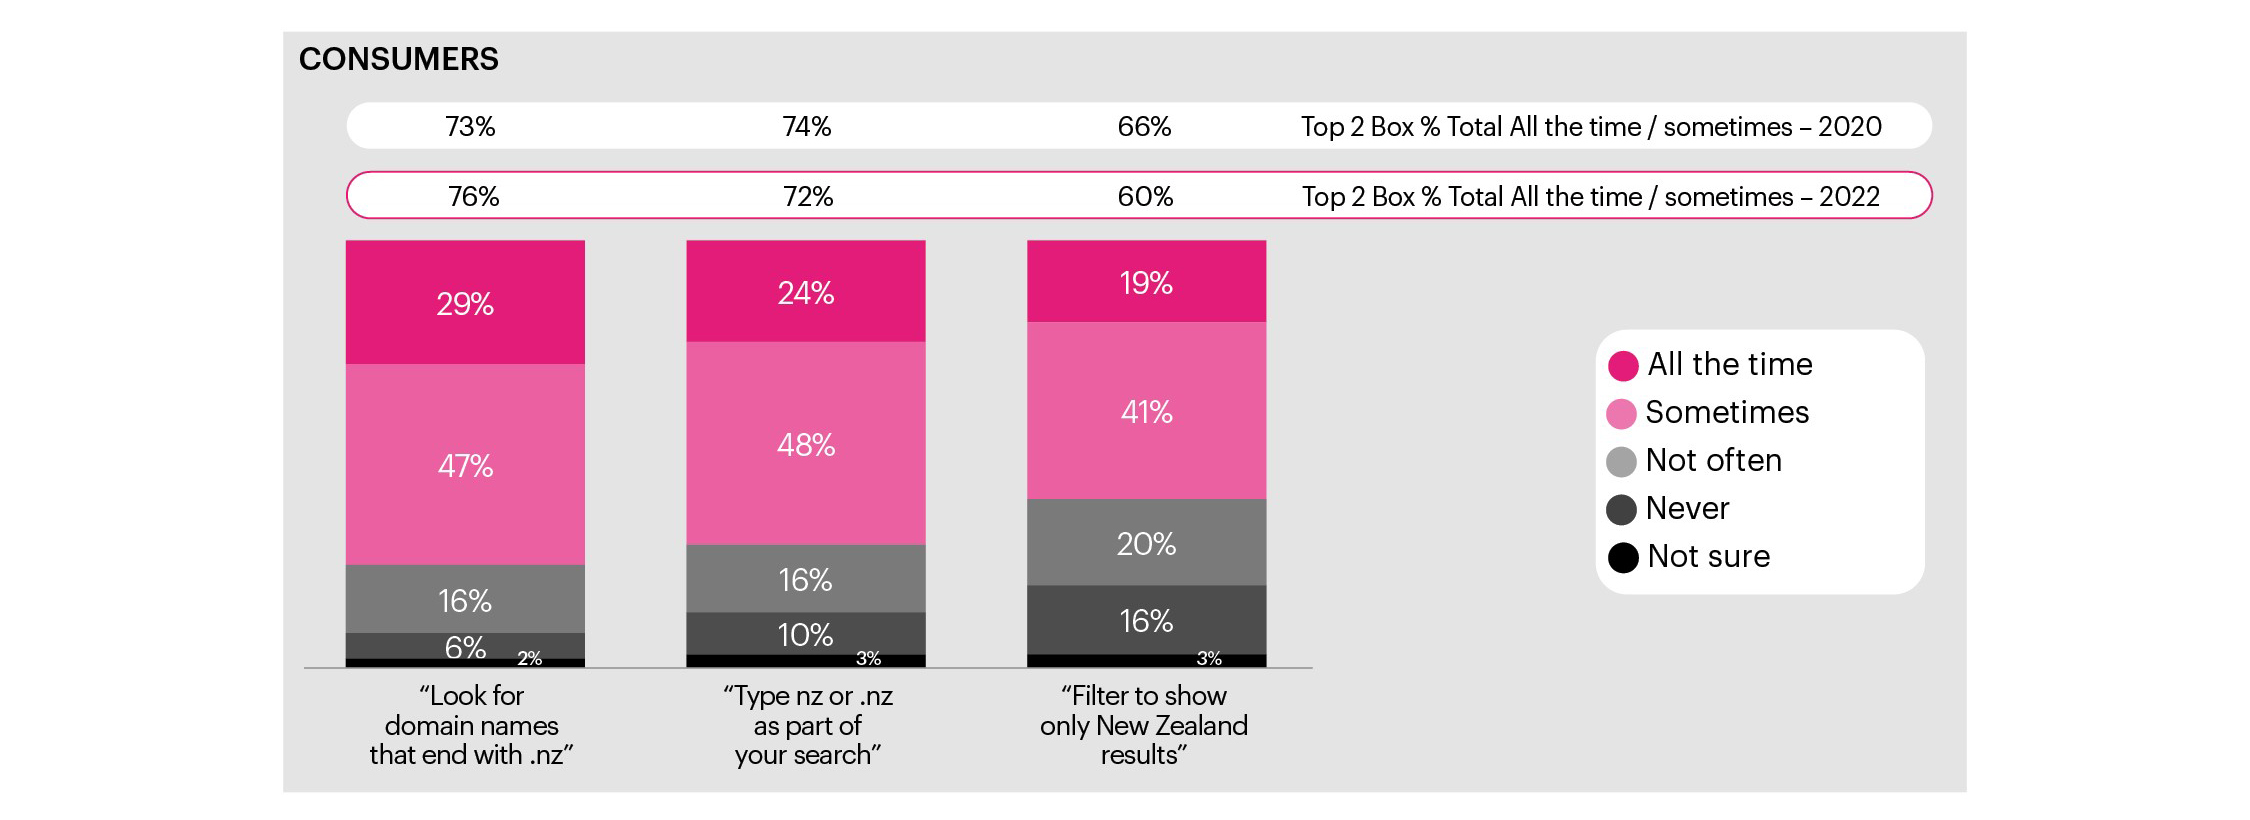
Online search behaviour chart description
This chart shows certain online search behaviour patterns among consumers. It shows that 76% of consumers look for domains that end with .nz when searching online, with 72% typing nz or .nz as part of their search and 60% filtering the search results to show New Zealand results only.
It also shows that these numbers are quite close to 2020 results, when 73% of consumers looked for domains that end with .nz when searching online, with 74% typing nz or .nz as part of their search and 66% filtering the search results to show New Zealand results only.
Numerical values presented on the image:
| Online search behaviour in 2022 | All the time | Sometimes | Not often | Never | Not sure |
| Look for domain names that end with .nz | 29% | 47% | 16% | 6% | 2% |
| Type nz or .nz as part of your search | 24% | 48% | 16% | 10% | 3% |
| Filter to show only New Zealand results | 19% | 41% | 20% | 16% | 3% |
Figure 18: brand image perceptions of .nz
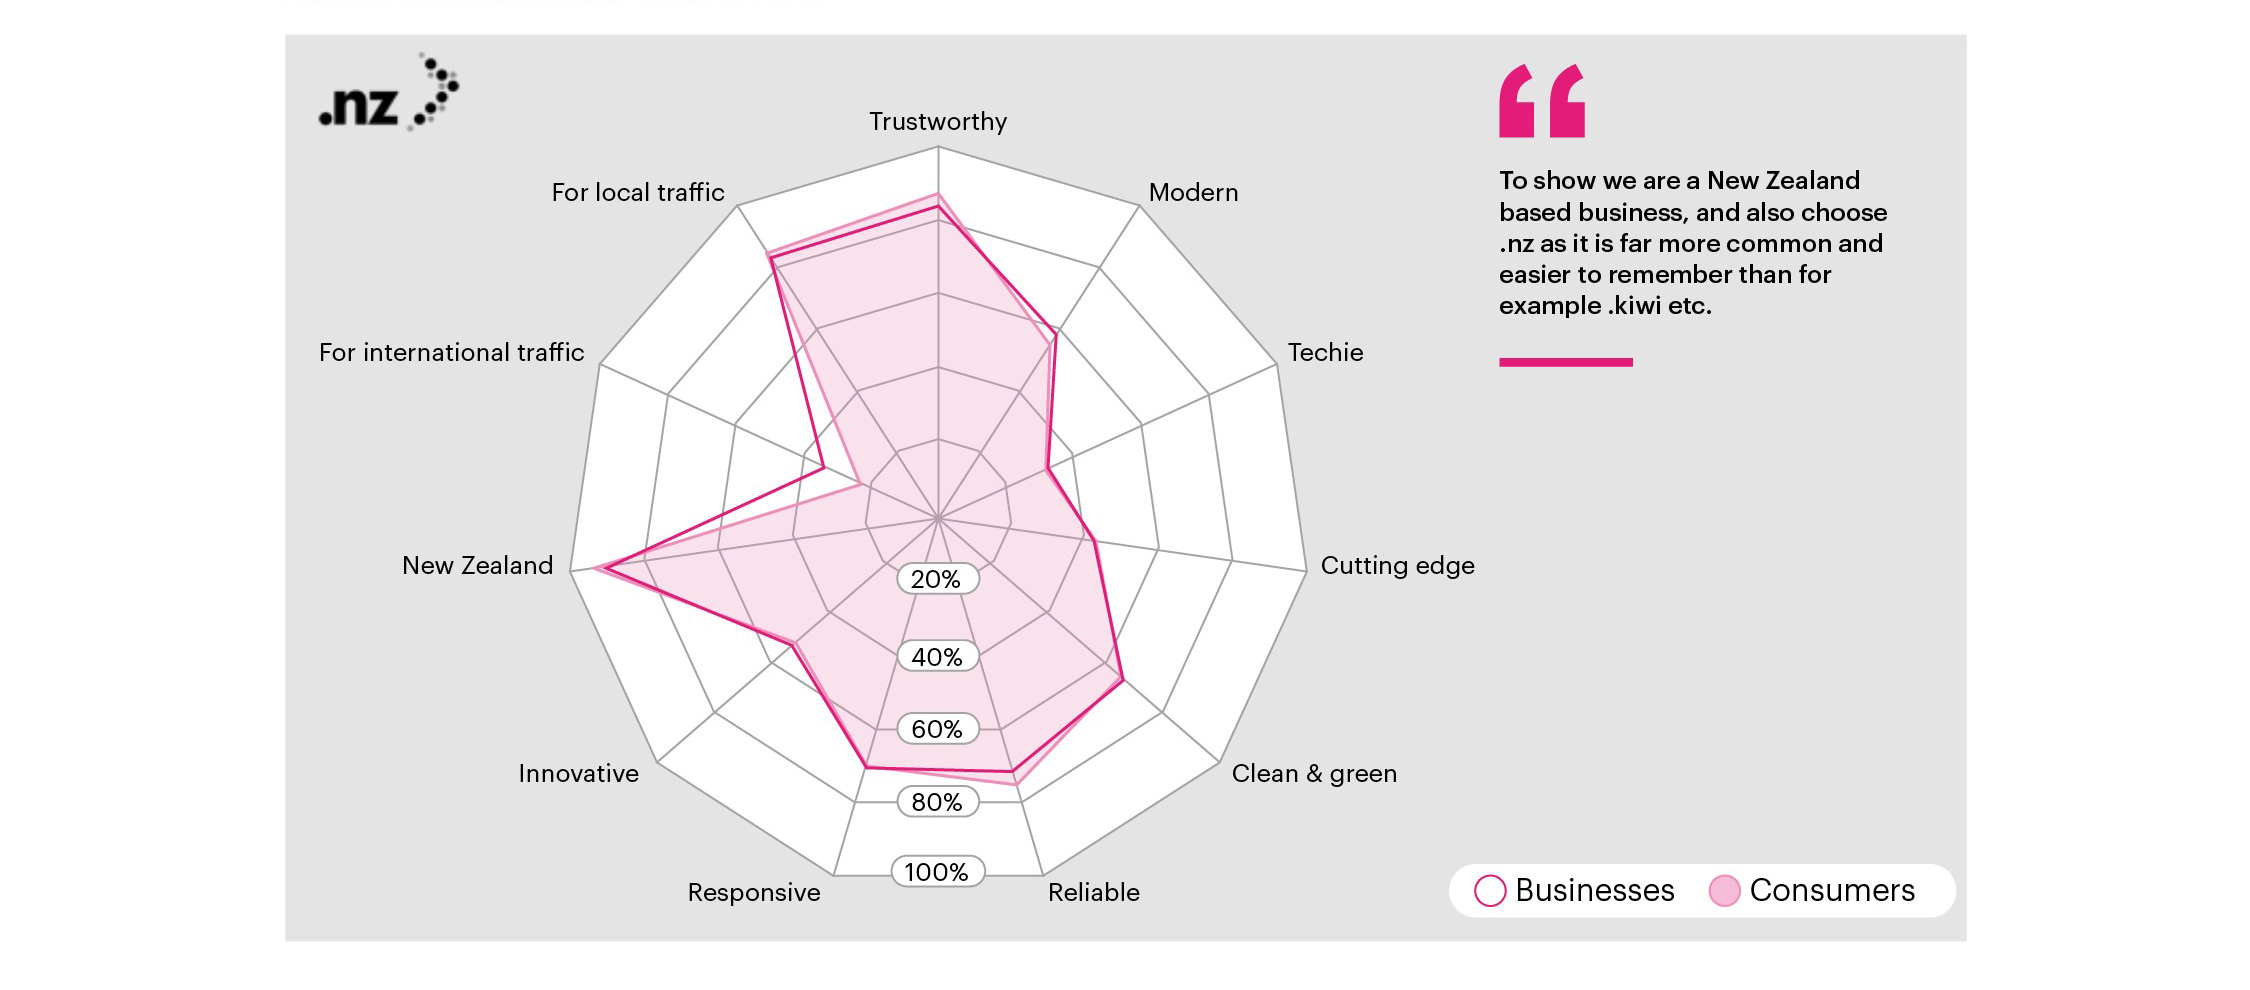
Brand image perceptions of .nz chart description
This spider web chart shows brand image perceptions of .nz for businesses and consumers. The chart shows that the perceptions are consistent among both groups. Both consumers and businesses in New Zealand think .nz is trustworthy, for local traffic, reliable, responsive, associated with New Zealand, clean and green.
Both consumers and businesses don't associate .nz domain names much with international traffic, being techie, innovative and cutting edge.
The only real difference in perceptions is businesses are slightly more likely to associate .nz with international traffic
The image also contains a quote from one of the research respondents, saying 'to show we are a New Zealand-based business, and also choose .nz as it is far more common and easier to remember than for example .kiwi etc.'
Study details
Online survey conducted by Yabble:
- 2022 – 5th April to 10th May 2022
- 2020 – 29th October to 20th November 2020
Designed to provide insight into how Aotearoa businesses and consumers are using domain names and their thoughts around different types of domain names.
Total of 1,125 consumers answered the survey online. Representative of New Zealand population 18 years plus by age, gender, ethnicity and location.
Margin of error on results +/-3%.
Total of 1,082 businesses answered the survey online. Providing a cross-section of New Zealand business landscape by region and size.
Margin of error on results +/-3%.