Registrar Size Prediction (Jan 2018)
Huayi Jing •
An interesting request we received after the register size prediction presentation at the Registrar Conference earlier last year, was a suggestion of applying similar methodology on the data per registrar. In this blog post, we will share the methodology and insights found during the registrar size prediction modelling.
Descriptive analysis
As of 1st August 2017, there are 89 active registrars in the .nz register. The prediction procedure is not feasible for all the registrars. Two features help us to determine whether a registrar’s data is statistically ready for prediction: (1) the age, i.e. how long a registrar’s data has existed in the register. The more data points we have for prediction modelling, the more accurate the prediction will be. (2) the size. The larger a registrar’s size is, the clearer the trend we may find underlying the historical change in its size.
As shown in the above figure, the distribution of a registrar’s age and size exhibits interesting points. Among these registrars, 40 of them have under 1000 active domains. The smallest registrar, although it has been recorded since June 2010, has only 7 domains. The age distribution shows the opposite. 76 registrars are older than 5 years old, among which 56 registrars are older than 10 years old (Note that there have been transfers of domains between registrars now and then for different reasons, so some of the information here might not be precise). The registrars that are at least 60 months old and have at least 5000 domains are selected for prediction. That leaves us 20 registrars.
The prediction
The prediction procedure follows the one described in the previous blog. Two assumptions are made so that the procedure can be applied: (1) although a domain might be transferred to another registrar, it is treated as a new create into that registrar. (2) different SLDs are assumed to behave similarly, so that we have enough data points for prediction.
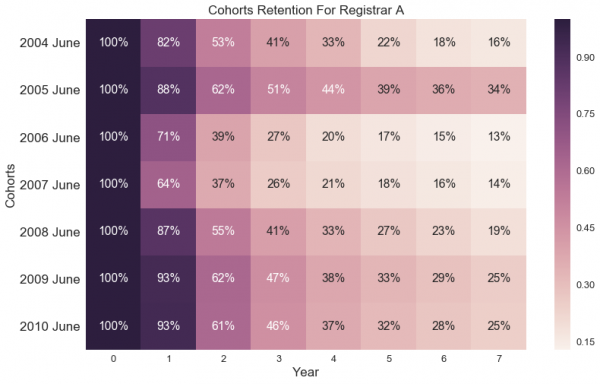
Let’s first have a look at the retention behaviour. Take Registrar A as an example, the following two figures show the retention behaviour of domains registered at different periods (i.e. cohorts, the retention rate is estimated using multi-cohorts data). It can be seen that the drop out rate is high in the early years and then slows down as the domains stay longer. From the heat map we can observe, on average, the retention rate of relatively recent cohort is higher, which is a good thing to know.
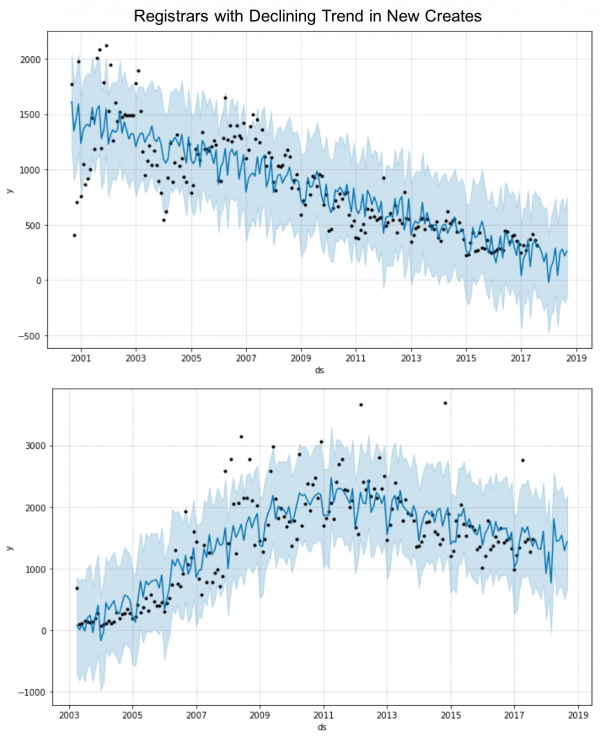
The new creates forecast reveals some interesting findings as well. See the two registrars showing below, the historical new creates data shows a clear downward trend. This might indicate a change in the focus of the business. The forecast therefore could be negative for some periods and will be replaced by zero.
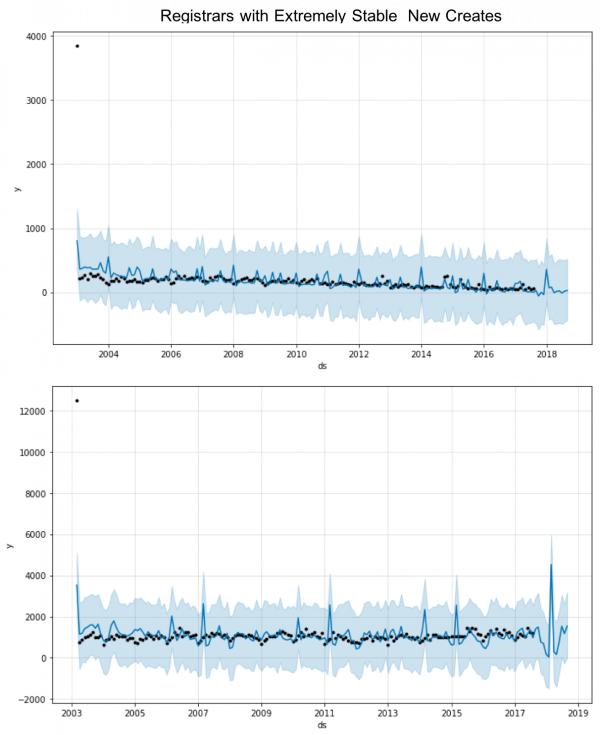
Some registrars have extremely stationary and low-quantity new creates over time, see the figure below. For such registrars, there are barely trend or cyclic fluctuations underlying the data points.
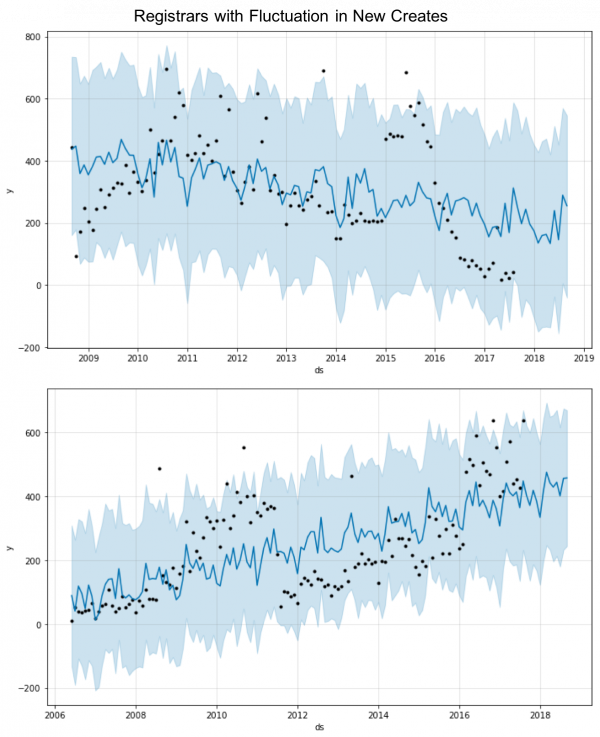
On the opposite, some registrars have new creates data that fluctuates greatly and shows no clear trend or seasonality. Accurate forecasts for such cases are hard. A further look at the reasons behind those fluctuations will be helpful for more reasonable forecast.
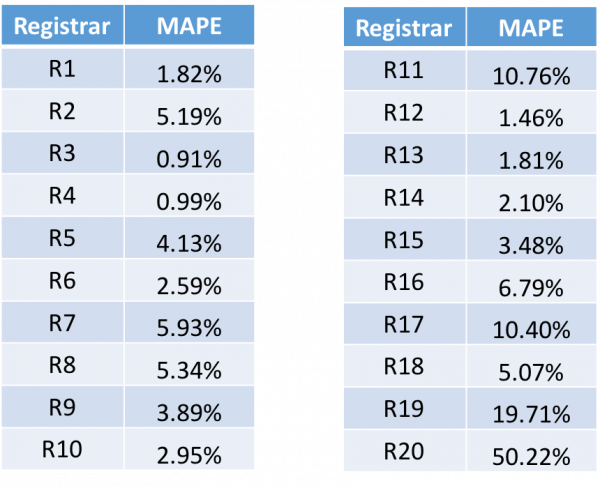
To test the performance of the prediction, historical data up to May 2017 is used to make prediction for June, July and August 2017. The table below shows the MAPE (mean absolute percent error) for each registrar in descending order by size. As mentioned before, smaller registrar size makes it harder for prediction. Hence it is not surprising to see some of the bottom 10 registrars have a MAPE greater than 10%. In general, our procedure generates comparatively accurate prediction for relatively big registrars.
Finally, let’s see the prediction results for the top 20 registrars. The total size of this group is increasing over time. Larger registrars also show an increasing trend. Some registrars’ size decrease slightly each month. This is due to the forecasted low new creates and/or comparatively larger number of drop outs in certain months.
Registrar size prediction is more challenging compared with register size prediction due to the data quality after segmentation. Nonetheless, some interesting findings surface in between. Since bulk transfer of domains between registrars happen for various reasons (e.g., movement of re-sellers or large portfolio holders between registrars), a further investigation on those cases will help improve the quality of data and prediction. For data that is reasonably stationary, using a naive or moving average forecasting technique might be a better choice. These could be directions for follow on work.