What have Kiwis been doing with the Internet during lockdown?
Anonymous •
During lockdown, we wanted to look at what’s been happening with the Internet; how it has been used, where users have been going for information, and more. Our team put together some very useful graphs and we’ve got a sample here. You can see the full research here.
This has been done by looking at domain name system (DNS) traffic. The DNS is a core component of the Internet, translating a web address (internetnz.nz, for example) into numbers so computers can make sure you get to the right website.
Believe it or not, there are more than 4 billion queries each week for .nz domains! That’s a lot of activity. Let’s see what we can make of it.
Traffic during lockdown
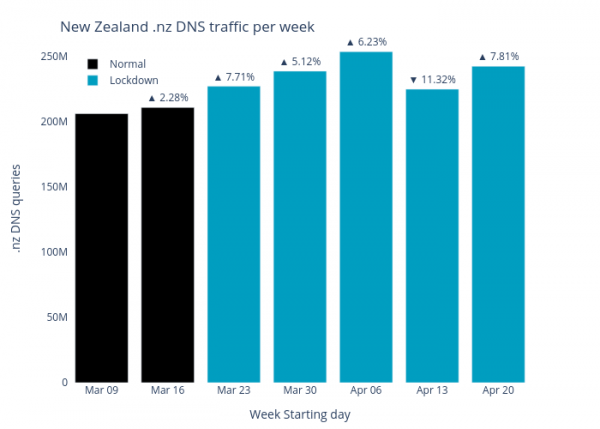
InternetNZ manages the .nz domain, which is the focus of our dataset for this investigation. Of the 4 billion queries generated each week, around 200 million originate from inside New Zealand and these queries are what we’re looking into. A query can be generated by activity such as a web search or an email being sent.
We looked at not only the four weeks of lockdown but the two prior to this, which we consider regular traffic. This allows us to see the change each week. As there have been more people working from home, an increase is expected (although in the final bar, a public holiday had to be taken into account). Also important is the amount of time people spend inside, with the Internet being a clear source of news, entertainment, and supplies through online orders.

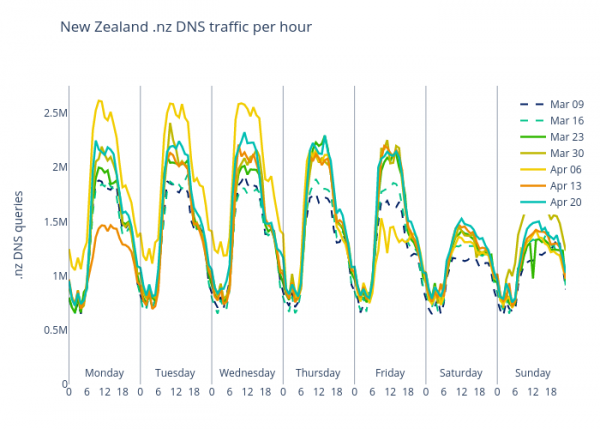
To take it a step further, we can also see the time of day when traffic increases the most each week. The graph below shows a clear pattern, with a spike between 10am and 11am followed by another close to 4pm each weekday. Whether starting or finishing work, mid-morning meetings or something else, these peaks have been consistent throughout lockdown.

Creating the groups
To learn more, we grouped industries and websites together to see where users were going, for information, supplies, entertainment, and more. This lets us see the overall trend of what the Internet was being used for.
The list is just a sample, to give you an idea:
|
Group
|
Domains included
|
|
Banks
|
asb.co.nz, bnz.co.nz, westpac.co.nz, kiwibank.co.nz, anz.co.nz
|
|
Government
|
covid19.govt.nz, mbie.govt.nz, police.govt.nz, treasury.govt.nz, ird.govt.nz, health.govt.nz, msd.govt.nz, studylink.govt.nz
|
|
Retail
|
thewarehouse.co.nz, briscoes.co.nz, kmart.co.nz
|
|
Streaming
|
netflix.co.nz, tvnz.co.nz, neontv.co.nz, sparksport.co.nz, lightbox.co.nz
|
|
Supermarket
|
countdown.co.nz, newworld.co.nz, paknsave.co.nz
|
|
Travel
|
houseoftravel.co.nz, flightcentre.co.nz, expedia.co.nz, safetravel.govt.nz, statravel.co.nz, helloworld.co.nz, airnz.co.nz
|
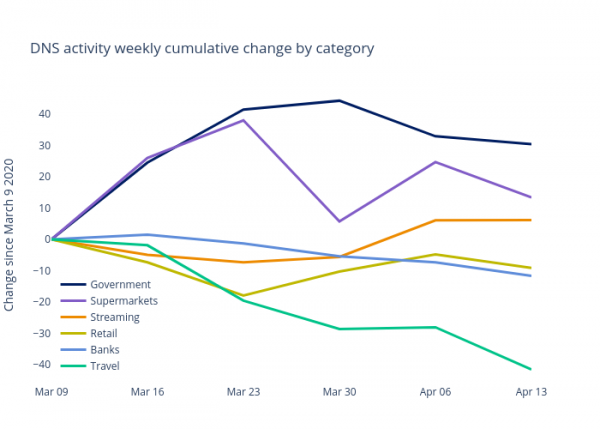
Using the week of 9 March as a control, or starting point, we can then see the difference in these groups over time during lockdown.
How have Kiwis been using the Internet?
The results are interesting. As expected, traffic to .nz domains for Government increased and became the main source of information for a range of topics and issues. Similarly, supermarkets saw a surge in traffic, although this did dip as routines became more stable. Public holidays will have made a difference, and so will the decision between ordering online and going into stores at various times.

Streaming platforms saw an increase overall, but not as much as you may have thought - however, it should be pointed out that Netflix, Disney+ and the like don’t use their .nz address, and this impacts our data.
While unfortunate, but not unexpected, travel websites lost a lot of activity due to the restrictions in place. We hope this will change once normality returns.
There’s a lot more data to dig through, and you can find it here. The language used will be more technical and scientific but this is a great snapshot of what’s been happening over the last few weeks.